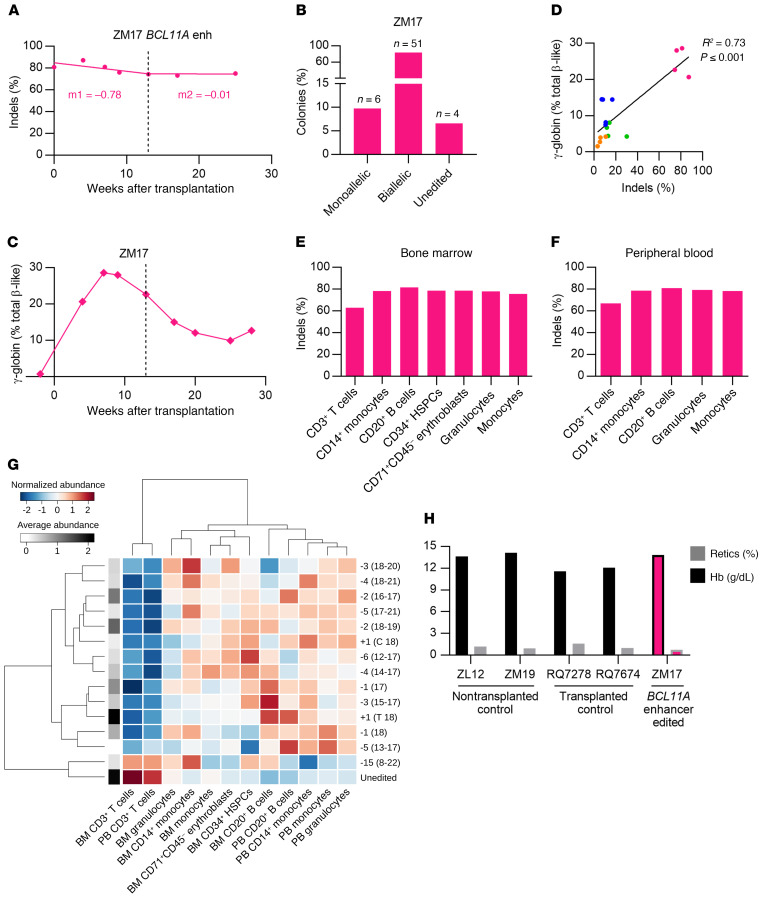
Figure 3. Robust BCL11A enhancer editing and γ-globin induction.
(A) Editing frequencies in granulocyte fraction in ZM17. Slopes were calculated separately for the first 13 weeks of transplantation (early progenitor phase) and later time points (HSC phase) as indicated by the dashed line. (B) Distribution of monoallelic and biallelic edited colonies collected from methylcellulose plates for bone marrow mononuclear cells of ZM17 at 28 weeks after transplantation. (C) γ-globin protein expression by RP-HPLC in peripheral blood of ZM17. (D) Correlation of editing frequencies in all transplanted animals (4–13 weeks after transplantation) with γ-globin protein expression by RP-HPLC. (E) Editing frequencies in BM-derived CD3+ T cells, CD14+ monocytes, CD20+ B cells, CD34+ HSPCs, CD71+ CD45– erythroblasts, and granulocytes and monocytes sorted using FSC A and SSC A. (F) Editing frequencies in PB-derived granulocytes, monocytes, CD3+, CD14+, and CD20+ cells. (G) Heatmap representation for normalized alleles abundance values among BM and PB lineages of ZM17 at 28 weeks after transplantation. The allele-specific average abundance value (log) is represented in grayscale on the left side of the heatmap. Both columns (lineages) and rows (alleles) are ordered according to their similarity measured by Ward distance. (H) Hemoglobin (Hb) and reticulocyte count percentages in nontransplanted (ZL12 and ZM19), lentivirus-transduced (GFP vector–transduced) CD34+ HSPC-transplanted (RQ7278 and RQ7674), and BCL11A enhancer–edited animals (ZM17).

