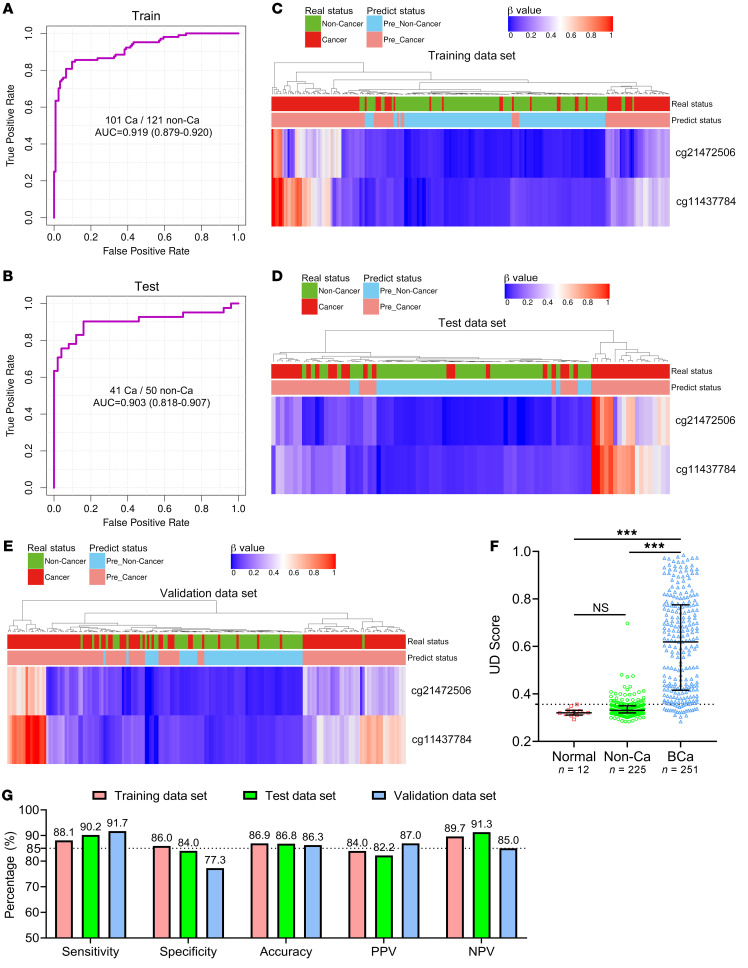
Figure 3. Construction and validation of a urine diagnostic model to detect BCa in 3 cohorts by using 2 markers.
(A and B) ROC curves and the associated AUCs of the diagnostic prediction model using urine DNA methylation analysis in the training (A) and testing (B) cohorts. (C–E) Unsupervised hierarchical clustering of 2 methylation markers that were differentially methylated between the DNA of BCa and non–cancer subjects in the training (C, n = 222), testing (D, n = 91), and independent prospective validation (E, n = 175) cohorts. Each row represents an individual patient and each column is a CpG marker. The real disease status and prediction status by model are shown ahead. (F) The UD score of healthy participants (n = 12), non–cancer patients (n = 225), and patients with BCa (n = 251) are shown. The dotted line shows the cutoff value (0.3564) to distinguish BCa from non–cancer cases. The data are shown as median with the interquartile range. Statistical significance was assessed using 1-way ANOVA followed by Dunnett’s tests. (G) The sensitivity, specificity, accuracy, PPV, and NPV of this model in the training, testing, and validation cohorts were determined by the cutoff value. ***P < 0.001.

