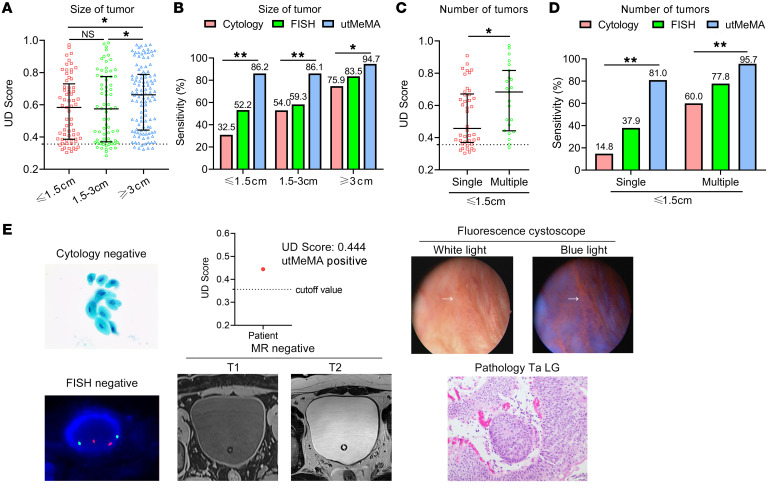
Figure 5. Application of utMeMA to detect minimal BCa tumor.
(A and B) The UD score and sensitivity of utMeMA in patients with different BCa tumor sizes, in comparison with urine cytology and FISH. Statistical significance was assessed using 1-way ANOVA followed by Dunnett’s tests (A) and χ2 test (B). (C and D) The UD score and sensitivity of utMeMA in patients with BCa with single or multiple small tumors, in comparison with urine cytology and FISH. Statistical significance was assessed using unpaired t test (2-tailed, C) and χ2 test (D). The data are shown as median with the interquartile range (A and C). (E) Example of a patient with minimal tumor detected by utMeMA, but missed by cytology, FISH, MR imaging, and ordinary cystoscopy, who was later diagnosed by fluorescence cystoscopy. The pathology of the tumor was Ta and low grade. *P < 0.05, **P < 0.01. The magnifications of the images in fluorescence cystoscopy, urine cytology, FISH and pathology were ×10, ×600, ×3000, ×400, respectively.

