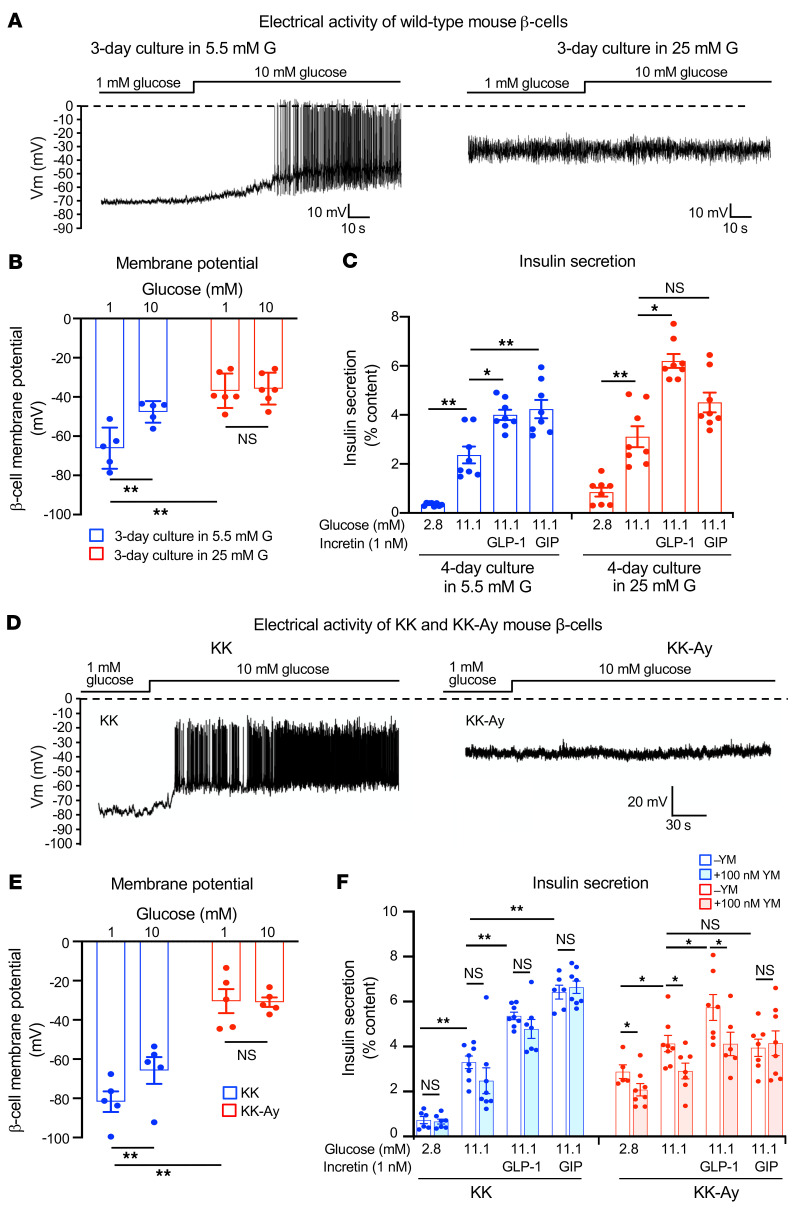
Figure 5. β Cell membrane potential and insulin secretion from islets in various models of β cell persistent depolarization.
(A) Representative traces of electrophysiological recordings of primary β cells of WT mice. Recordings were made in the presence of 1 mM glucose after chronic (3 days) culture of WT mouse islets in normal glucose (5.5 mM) or high glucose (25 mM). G, glucose. (B) Membrane potential of primary β cells of WT mice measured under the same conditions as described in A (n = 5–6 for each condition). (C) Insulin secretion from WT mouse islets. Insulin secretion was measured after chronic (4 days) culture of WT mouse islets in 5.5 mM (blue) or 25 mM (red) glucose (n = 8 for each condition). (D) Representative traces of electrophysiological recordings of primary β cells of KK and KK-Ay mice. Recordings were made in the presence of glucose at the concentrations indicated. (E) Membrane potential of primary β cells of KK and KK-Ay mice. Membrane potential was measured in the presence of glucose at concentrations indicated (n = 6 for each condition). (F) Insulin secretion from the islets of KK and KK-Ay mice (n = 6–8 for each condition). Statistical analyses were performed by 2-way ANOVA (B, C, E, and F), followed by Tukey’s post hoc test (C and F). Data are represented as mean ± SEM. *P < 0.05; **P < 0.01.

