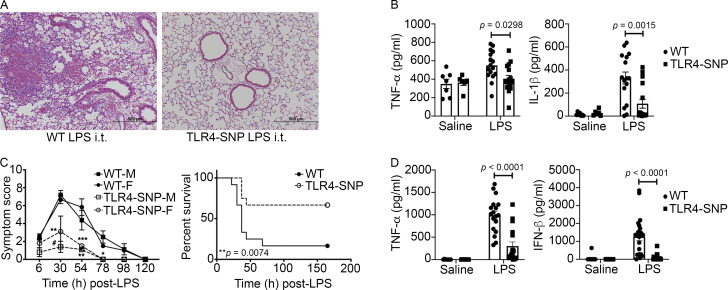
Figure 2.
TLR4-SNP mice exhibit LPS hyporesponsiveness in vivo. (A) TLR4-SNP mice exhibit reduced lung pathology in response to i.t. LPS (5 µg/mouse). Representative H&E-stained lung sections from WT vs. TLR4-SNP mice 18 h after LPS treatment (n = 16 LPS-treated/strain in three separate experiments; 100× magnification, scale bars = 500 µm). In this and all subsequent figures, age- and sex-matched WT (C57BL/6J) mice were purchased from the Jackson Laboratory; TLR4-SNP mice were engineered onto a C57BL/6J background, and TLR4−/− mice were backcrossed onto a C57BL/6J background for >12 generations (see Materials and methods). (B) TNF-α and IL-1β protein levels in lung homogenates of mice treated as in A. Each point represents an individual mouse; each column represents the mean ± SEM. Data were analyzed by one-way ANOVA with Tukey’s post hoc test. For LPS-treated (n = 16/strain, combined data from three independent experiments) WT vs. TLR4-SNP mice, TNF-α, P = 0.0298; IL-1β, P = 0.0015. (C) TLR4-SNP mice exhibit reduced symptoms in response to lethal i.p. LPS. Left: Age-matched male (M) and female (F) WT and TLR4-SNP mice (n = 5 per sex/strain) were injected with LPS (600 µg/mouse i.p.) and cumulative symptom scores recorded at the indicated time points (mean ± SEM). Data are representative of three separate experiments. Differences between males and females of the same strain were not significant. Comparison of WT vs. TLR4-SNP mice revealed the following significant differences by sex as analyzed pairwise by nonparametric Mann–Whitney U test: at 30 h, male, #, P = 0.0079; female, not significant (N.S.); at 54 h, male, **, P = 0.0159; female, ***, P = 0.0286; at 78 h, male, *, P = 0.0079; female, not applicable (single survivor in the WT group). Right: WT and TLR4-SNP mice were injected i.p. with LPS (30 mg/kg) and survival monitored. This experiment is representative of three independent experiments; n = 10 mice (5 males, 5 females)/strain; P = 0.0074 (log-rank Mantel-Cox test). (D) Serum TNF-α and IFN-β protein 2 h after nonlethal LPS administration (25 µg/mouse i.p.). Each point represents an individual mouse: WT saline (n = 8); TLR4-SNP saline (n = 7), WT LPS (n = 18), and TLR4-SNP LPS (n = 17; derived from three separate experiments). Each column represents the mean ± SEM. Data were analyzed by one-way ANOVA with Tukey’s post hoc test. For LPS-treated WT vs. TLR4-SNP mice, TNF-α, P < 0.0001; IFN-β, P < 0.0001.

