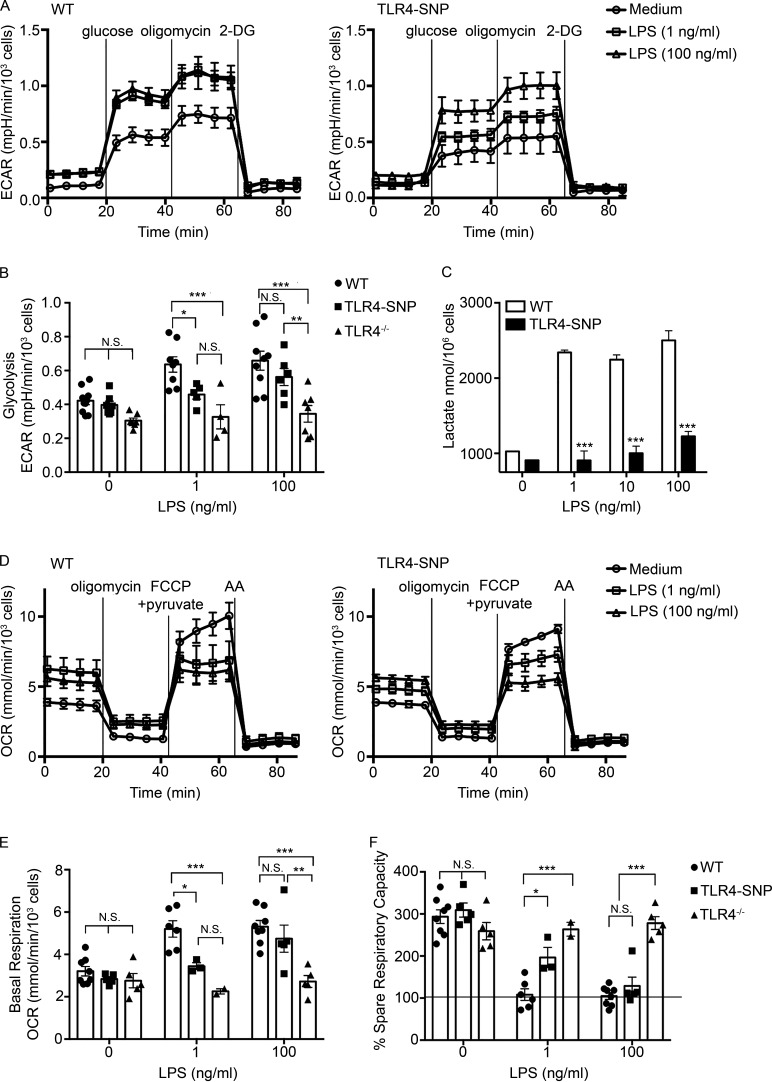
Figure 4.
TLR4-SNP macrophages exhibit reduced metabolic activation in response to LPS. (A) Glycolytic stress test performed on thioglycollate-elicited macrophages derived from WT and TLR4-SNP mice. Results represent the mean ± SEM of a representative experiment shown as a Seahorse wave plot. (B) Glycolysis measurements ([ECAR with 10 mM glucose] − [ECAR after 1-h glucose starvation]) from glycolytic stress tests were performed as in A, with some experiments including TLR4−/− macrophages as an additional negative control. Each data point shows the average response of two to five technical replicates of a separate pool of thioglycollate-elicited macrophages from a total of nine independent experiments (at 1 ng/ml LPS: WT, n = 8; TLR4-SNP, n = 5; TLR4−/−, n = 4; at 100 ng/ml LPS: WT, n = 9; TLR4-SNP, n = 6; TLR4−/−, n = 7; columns represent mean ± SEM). Data were analyzed by two-way ANOVA (α = 0.10), with Sidak’s multiple comparison post-tests to compare WT vs. TLR4-SNP responses: untreated, not significant (N.S.); 1 ng/ml LPS, P = 0.067; 100 ng/ml LPS, N.S.; WT vs. TLR4−/− responses: untreated, N.S.; 1 ng/ml LPS, P = 0.0003; 100 ng/ml LPS, P < 0.0001; TLR4-SNP vs. TLR4−/− responses: 100 ng/ml LPS, P = 0.0086 (adjusted for multiple comparisons). (C) Macrophages isolated from WT and TLR4-SNP mice were stimulated for 24 h with the indicated dose of LPS (0–100 ng/ml). Culture supernatants were assayed for the concentration of L-lactate using an enzymatic detection kit. The data represent the mean ± SD for a representative experiment of two separate experiments. Data were analyzed by one-way ANOVA, with Tukey’s post hoc test to compare WT vs. TLR4-SNP responses; ***, P < 0.0001 for each pair. (D) Mitochondrial stress test performed on macrophages derived from WT and TLR4-SNP mice. Results represent the mean ± SEM of a representative experiment shown as a Seahorse wave plot. (E) Basal respiration ([OCR before injections] − [OCR after inhibition of electron transport with AA]). Each data point shows the average response of two to five technical replicates of a separate pool of thioglycollate-elicited macrophages (at 1 ng/ml LPS: WT n = 6, TLR4-SNP n = 3, TLR4−/− n = 2; at 100 ng/ml LPS: WT n = 8, TLR4-SNP n = 4, TLR4−/− n = 5; from a total of seven independent experiments; columns represent mean ± SEM). Data were analyzed by two-way ANOVA (α = 0.10), with Sidak’s multiple comparison post-tests to compare WT vs. TLR4-SNP responses: untreated, N.S.; 1 ng/ml LPS, *, P = 0.032; 100 ng/ml LPS, N.S.; WT vs. TLR4−/− responses: untreated, N.S.; 1 ng/ml LPS, ***, P = 0.0006; 100 ng/ml LPS, ***, P < 0.0001; TLR4-SNP vs. TLR4−/− responses at 100 ng/ml LPS, **, P = 0.0026 (adjusted for multiple comparisons). (F) Percent SRC (100 × [(maximum OCR after uncoupling oxidative phosphorylation from the mitochondria with carbonyl cyanide 4-[trifluoromethoxy]phenylhydrazone and providing excess pyruvate) − (OCR before injections)] / [basal respiration]) from the same experiments as in E. Data were analyzed by two-way ANOVA (α = 0.10), with Sidak’s multiple comparison post-tests to compare WT vs. TLR4-SNP responses: untreated, N.S.; 1 ng/ml LPS, *, P = 0.021; 100 ng/ml LPS, N.S.; WT vs. TLR4−/− responses: untreated, N.S.; 1 ng/ml LPS, ***, P < 0.0001; 100 ng/ml LPS, ***, P < 0.0001; TLR4-SNP vs. TLR4−/− responses: 100 ng/ml LPS, ***, P < 0.0001 (adjusted for multiple comparisons). FCCP, carbonyl cyanide 4-(trifluoromethoxy)phenylhydrazone.

