Figure 6.
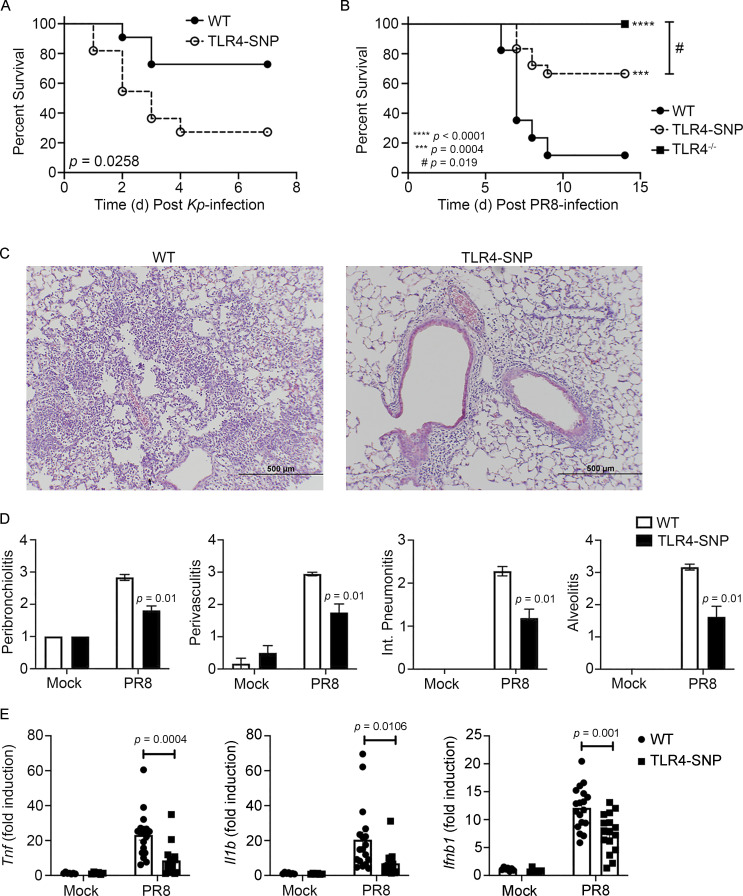
Altered susceptibility of TLR4-SNP mice to Kp and PR8 infections. (A) WT and TLR4-SNP mice were infected with Kp B5055 (∼1,200 CFU i.p.) and monitored daily for survival for 7 d. Data represent the combined results of two separate experiments (n = 11 mice/strain). Data analyzed by log-rank Mantel-Cox test. P = 0.0258. (B) WT, TLR4-SNP, and TLR4−/− mice were infected with influenza PR8 (∼7,500 TCID50 i.n.) and monitored daily for survival for 14 d after PR8 infection. Data represent the combined results of three separate experiments (WT, n = 15; TLR4-SNP, n = 18; TLR4−/−, n = 14). Data analyzed by log-rank Mantel-Cox test. TLR4−/− vs. TLR4-SNP: #, P = 0.019; WT vs. TLR4-SNP: ***, P = 0.0004; WT vs. TLR4−/−: ****, P < 0.0001. (C and D) WT and TLR4-SNP mice were infected as in B. On day 6 after infection, mice were euthanized and the lungs extracted, fixed, and sectioned for histology after H&E staining. (C) Representative sections from PR8-infected WT and TLR4-SNP mice are shown (magnification 100×; scale bars = 500 µm). (D) Lung histopathology scoring. Data from mock- or PR8-infected mice represent the mean ± SEM of two separate experiments (6 mice/strain for mock treatment; 18 mice/strain for PR8 infection). Data analyzed by two-way ANOVA with Tukey’s post hoc test. PR8-infected WT vs. TLR4-SNP: P = 0.01 for each histological parameter scored. (E) Gene expression analysis by qRT-PCR of lung RNA from WT and TLR4-SNP mice infected as in B. Each point represents the responses of individual mice from two separate experiments (identical to the mice in D). Columns represent the mean ± SEM. Data were analyzed by two-way ANOVA with Tukey’s post hoc test. PR8-infected WT vs. TLR4-SNP: Tnf, P = 0.0004; Il1b, P = 0.0106; Ifnb1, P = 0.001.

