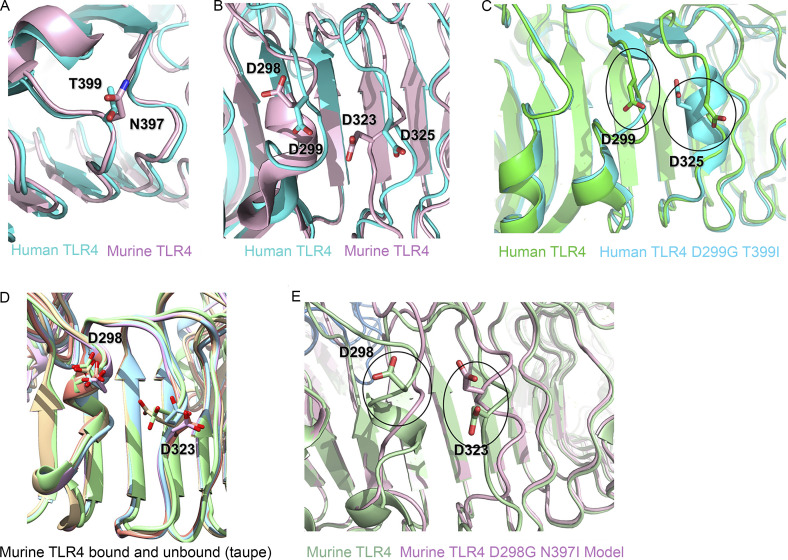
Figure S1.
Structural analysis of the D298 region in murine TLR4 D298G/N397I model. (A) Superimposed models of human T399 (blue) and murine N397 SNPs (pink). (B) Superimposed models of WT human D299 (blue) and murine D298 (pink) to show the relative distance from D325 and D323, respectively. (C) Superimposed models of human WT D299 and human TLR4 D299G SNP and their relative proximity to D325. (D) Superimposition of five models showing differences in the orientation of murine TLR4 D298. (E) Superimposed models of murine WT (green) vs. murine TLR4 D298G (pink).

