Figure S2.
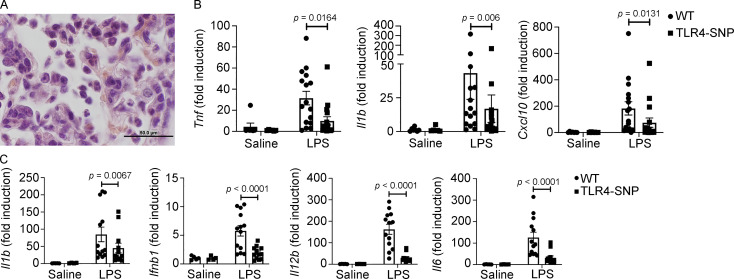
TLR4-SNP mice exhibit reduced lung pathology and cytokine mRNA in response to i.t. administration of LPS (5 µg/mouse). (A) Representative H&E-stained lung section from the WT mouse shown in Fig. 2 A showing neutrophil and lymphocyte infiltration at higher magnification (1,000×; scale bar = 50 µm). (B) Lung RNA was derived from the same mice described in Fig. 2 A, and cytokine mRNA was measured by qRT-PCR. Each point represents an individual mouse, and data are combined from three separate experiments. Each column represents the mean ± SEM. Data were analyzed by one-way ANOVA with Tukey’s post hoc test. LPS-stimulated WT vs. TLR4-SNP: Tnf, P = 0.0164; Il1b, P = 0.006; Cxcl10, P = 0.0131. (C) TLR4-SNP mice exhibit reduced liver cytokine mRNA in response to i.p. administration of LPS (25 µg/mouse). Liver RNA was derived from the same mice described in Fig. 2 D, and cytokine mRNA was measured by qRT-PCR. Each point represents the response of an individual mouse, and data are combined from three separate experiments. Each column represents the mean ± SEM. Data were analyzed by one-way ANOVA with Tukey’s post hoc test. LPS-stimulated WT vs. TLR4-SNP: Il1b, P = 0.0087; Ifnb1, P < 0.0001; Il12b, P < 0.0001; Il6, P < 0.0001.

