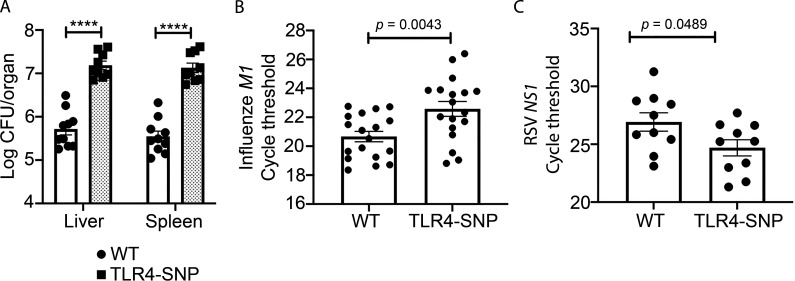
Figure S5.
Pathogen burden in WT- and TLR4-SNP–infected mice. (A) WT and TLR4-SNP mice were infected with Kp B5055 (∼1,500 CFU i.p.). Livers and spleens were harvested after 18 h for bacterial burden by CFUs for each organ. Data represent the combined results of two separate experiments (n = 10 WT; n = 9 TLR4-SNP). Data were analyzed by two-way ANOVA with Tukey’s post hoc test (****, P < 0.0001). (B) The identical samples from WT and TLR4-SNP mice shown in Fig. 6 E were analyzed by qRT-PCR for expression of the influenza M1 gene from two separate experiments. Data were analyzed by two-way ANOVA with Tukey’s post hoc test (P = 0.0043). (C) The WT and TLR4-SNP lung RNA samples shown in Fig. 7 A were used to measure RSV NS1 gene expression by qRT-PCR. Data were analyzed by two-way ANOVA with Tukey’s post hoc test (P = 0.0489).

