Figure 5.

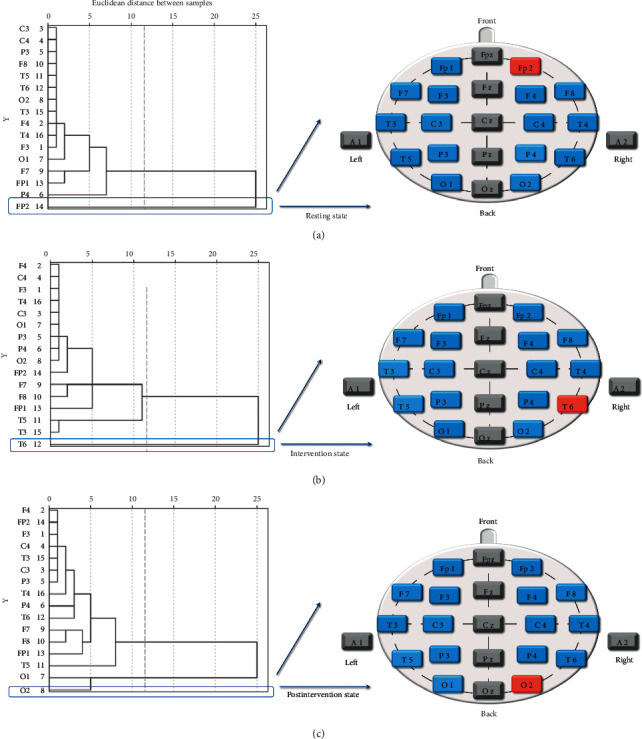
Cluster analysis diagram of ApEn at the three states. (a) Resting state, (b) intervention state (c) postintervention state.

Cluster analysis diagram of ApEn at the three states. (a) Resting state, (b) intervention state (c) postintervention state.