Figure 1.

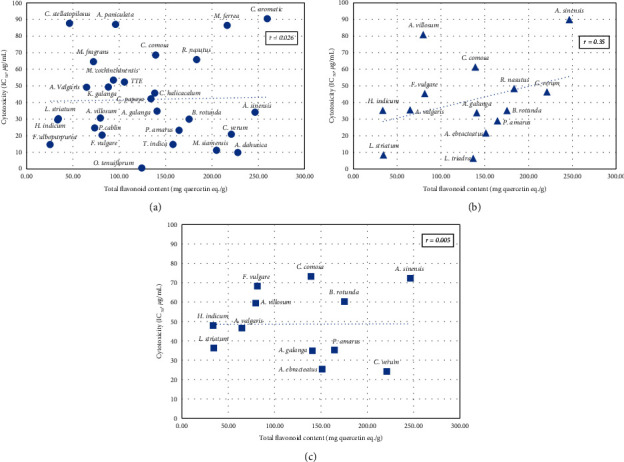
Scatter plots of flavonoid content and cytotoxicity of the plant extracts (IC50 < 100 μg/ml) against cancer cell lines. r = correlation coefficient, (a) = MCF-7, (b) = SKOV, (c) = Hela.

Scatter plots of flavonoid content and cytotoxicity of the plant extracts (IC50 < 100 μg/ml) against cancer cell lines. r = correlation coefficient, (a) = MCF-7, (b) = SKOV, (c) = Hela.