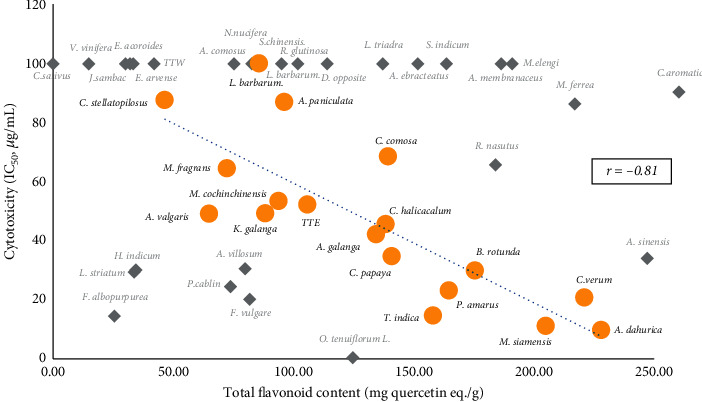
Figure 2.

Scatter plot of cytotoxicity to MCF-7 and total flavonoid content of some selected plant extracts. r = correlation coefficient. ( ) = the selected plant extracts that showed the correlation between total flavonoid content and cytotoxicity with correlation coefficient (r) value −0.81; (
 ) = the plant extracts that showed lesser correlation.
