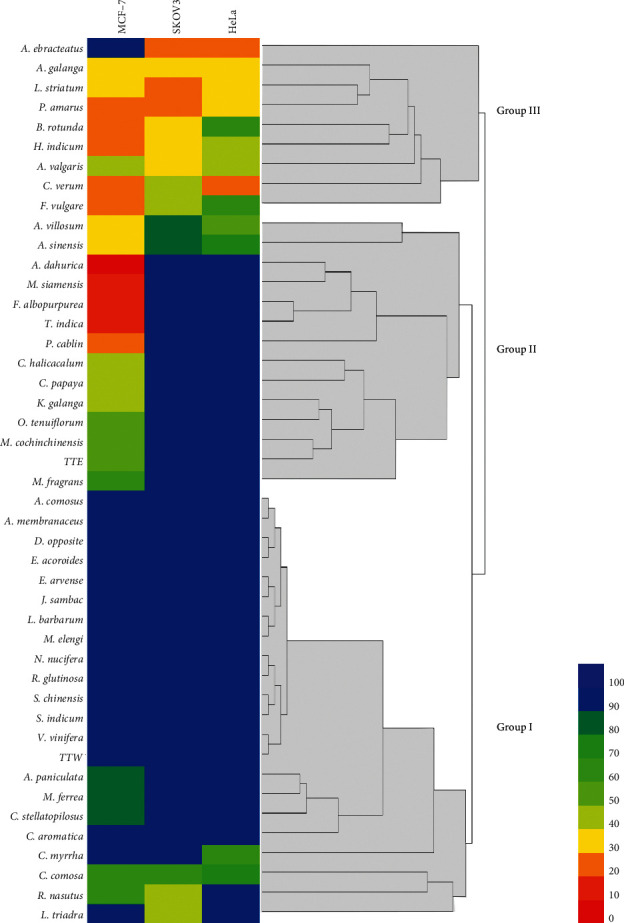
Figure 3.

Heat map and hierarchical cluster analysis of plant and remedy extracts. Color scale bar showed a range of IC50, red color bar represents more potent cytotoxic activity (0–10 μg/ml) incrementing to a blue color bar which represents weak cytotoxic activity (90–100 μg/ml).
