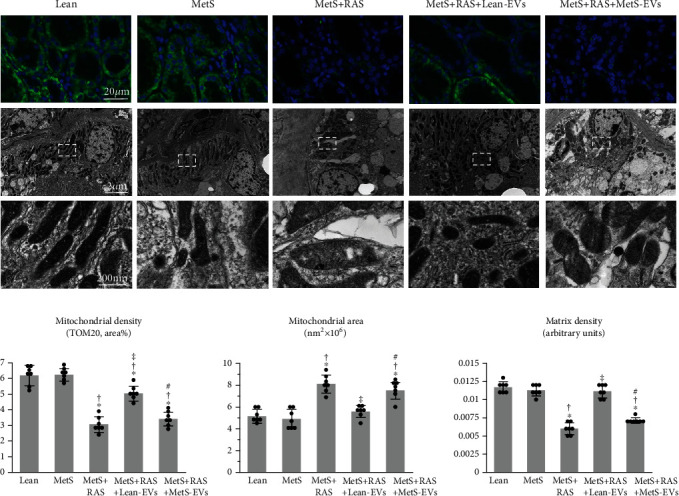
Figure 6.

MetS-EVs failed to improve the renal mitochondrial density and structure in MetS+RAS. (a) Representative immunofluorescence staining (original magnification ×40) for the mitochondrial outer membrane marker preprotein translocases of the outer membrane (TOM)-20 (green) and transmission electron microscopy of renal tubular cell mitochondria in study groups. (b) Renal mitochondrial density that decreased in MetS+RAS compared to Lean and MetS, improved in MetS+RAS+Lean-EVs, but failed to improve in MetS+RAS+MetS-EVs, as were the mitochondrial area and matrix density. ∗p < 0.05 vs. Lean; †p < 0.05 vs. MetS; ‡p < 0.05 vs. MetS+RAS; #p < 0.05 vs. MetS+RAS+Lean-EVs.
