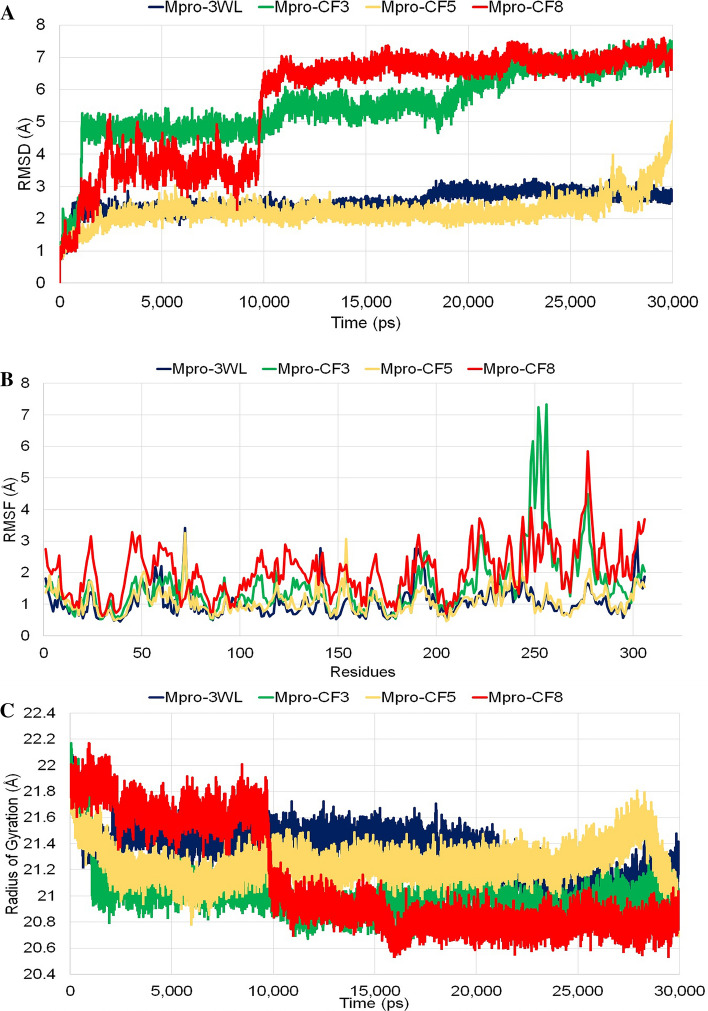
Fig. 2.
a Root mean square deviation of the receptor-ligand complexes; b Root mean square fluctuations of the residues of receptor-ligand complexes and c Radius of gyrations of the receptor-ligand complexes within the 30 ns simulation. In all the cases the complex Mpro-3WL is represented by blue line, Mpro-CF3 is represented by green line, Mpro-CF5 is represented by yellow line and Mpro-CF8 is represented by red line

