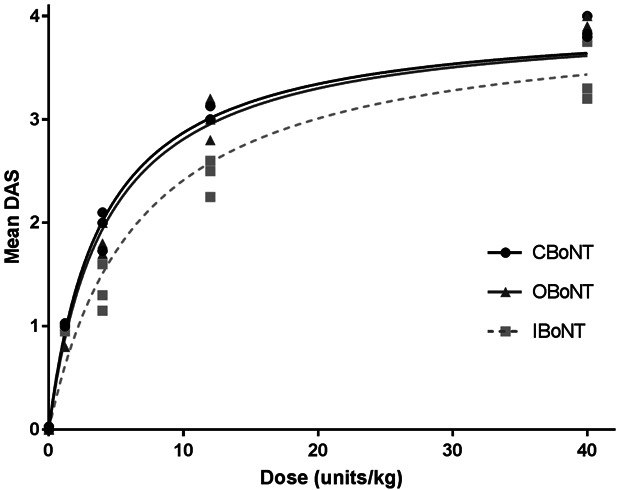
Figure 3.

Dose-maximal digit abduction score (DAS) response curve. Dose is expressed in U/kg of body weight. All lines represent best-fit three-parameter logistic regression curves and mean values from 3 independent experiments. Digit abduction score potency based on the median effective dose (ED50) was derived from this graph.
