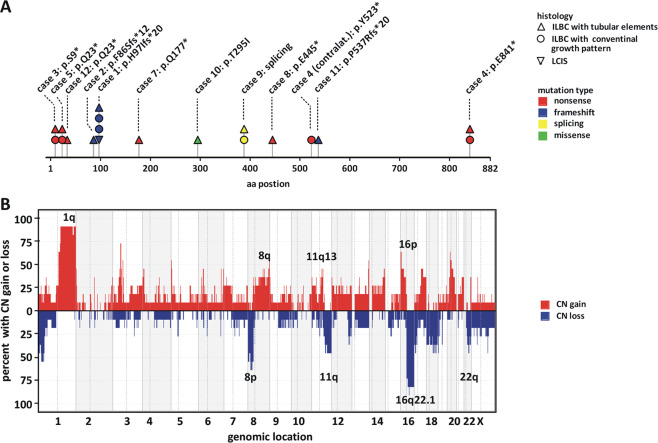
Fig. 3. CDH1 mutation and loss of chromosome 16q.
a Shown is the protein-coding sequence of the CDH1/E-cadherin gene. Lesion histology is coded by the symbol shape, as indicated in the legend. Mutation type is coded by the symbol color, as indicated in the legend. For details see Supplementary data Table 2. b Genome-wide view of CNAs detected in ILBCs with tubular elements (n = 11) based on whole-genome DNA CN profiles. Chromosomal localization is plotted on the x axis. The overall frequency of CN gains (red) and CN loss (blue) is plotted on the y axis.

