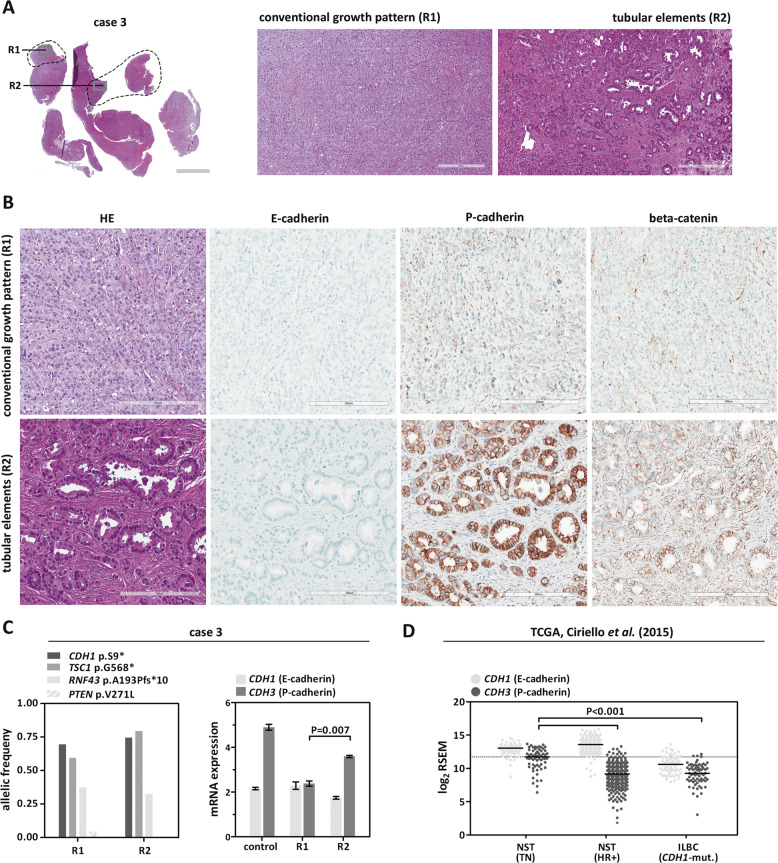
Fig. 5. Histology of ILBC with tubular elements.
Shown is representative specimen (case 3). a HE-stained section of an ILBC metastasis to the ovary, cut in slices (left, scale bar corresponds to 3 mm) and submacroscopic view (right, ×100 magnification, scale bar corresponds to 300 µm). The gray rectangle indicates areas shown in the submacroscopic view. Labels R1 and R2 indicate regions shown in detail. The dashed line indicates tumor areas subjected to microdissection for extraction of DNA and RNA. b Details from regions R1 (conventional growth pattern) and R2 (tubular elements). Photomicrographs of repeated immunohistochemical stainings for E-cadherin, P-cadherin, and beta-catenin from a second set of new consecutive serial sections (×200 magnification, scale bar corresponds to 200 µm). c Mutational analysis (left) and quantitative real-time RT-PCR (right). Expression of CDH1 (E-cadherin) and CDH3 (P-cadherin) was assessed in microdissected tumor tissue from regions R1 and R3. Shown is relative mRNA expression normalized to two housekeeping genes (GUSB and TBP). Error bars indicate SEM. Normal mammary tissue served as a control (independent patient). Statistical significance was determined with the unpaired t-test. d Re-analysis of TCGA gene expression data (Ciriello et al. [31]). Shown are normalized and log2-transformed RNAseq by expectation maximation (RSEM) data, reflecting relative mRNA expression. This re-analysis included n = 64 triple-negative BC of no special type (NST, TN), n = 327 hormone receptor-positive BC of no special type (NST, HR+), and n = 70 invasive lobular breast cancer with deleterious CDH1 mutation (ILBC, CDH1-mut.). Each dot corresponds to an individual BC. Horizontal lines; median expression levels. Dashed line; median expression level in triple-negative BC/NST. Statistical significance was assessed with the Mann–Whitney test.

