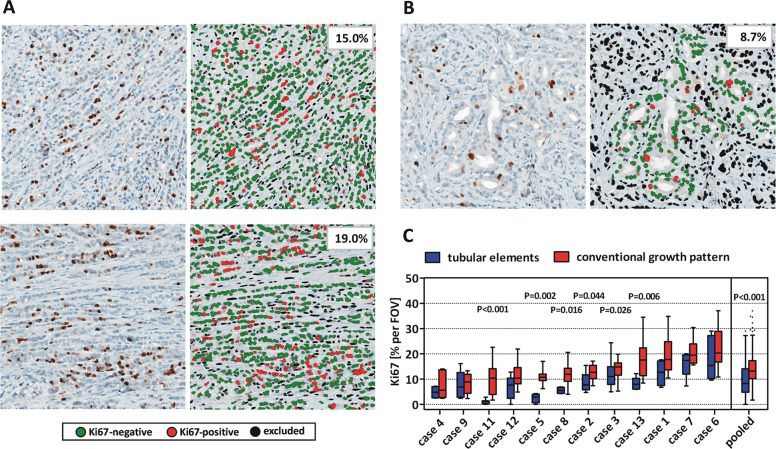
Fig. 8. Reduced tumor cell proliferation in tubular elements.
The percentage of Ki67-positive tumor cells was quantified in ILBC cells arranged in conventional growth pattern (a) or tubular elements (b). Shown are three representative fields of view (FOVs) of case 3. Ki67-stainings are shown in the left panels (×200 magnification) and Ki67 quantification by CognitionMaster software is shown in the right panels. c Traditional Tukey plot showing the distribution of Ki67 indices [% per FOV] in n = 11 ILBCs analyzed. Horizontal lines indicate the median Ki67 across multiple FOVs. Boxes indicate the interquartile ranges and whiskers indicate the 1.5-fold interquartile distance, or the minimal/maximal values, whichever is shorter. Statistical significance was determined with the Mann–Whitney test.

