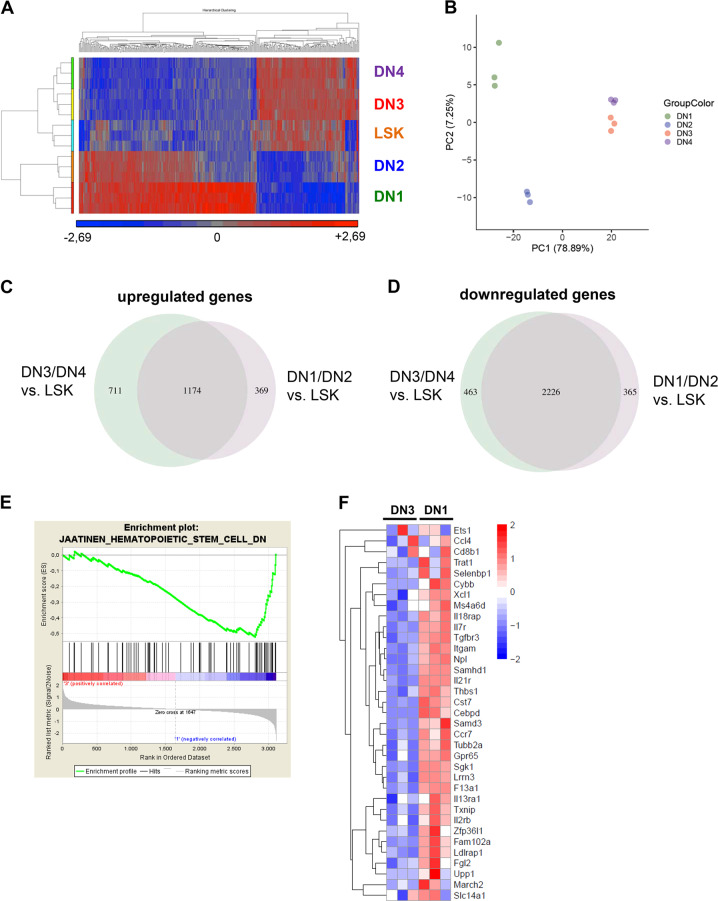
Fig. 5. The gene expression signature of the lymphoma stem cell population reveals a stem-cell-like transcriptional profile.
a Heatmap comparing gene expression levels of DN1-DN4 lymphoma subpopulations with the primitive LSK population. Color scale represents the raw Z-score mRNA intensity value. b Principle component analysis (PCA) separating lymphoma subpopulations DN1–DN4 according to their variance of all genes analysed by microarray. PCA was performed on the top 1000 variable genes based on the Median Absolute Deviation (MAD). c Venn diagram showing significantly upregulated genes comparing DN1/DN2 and DN3/DN4 lymphoma subpopulations vs. LSK cells analysed by microarray with a q value cut-off < 0.01. d Venn diagram showing significantly downregulated genes comparing DN1/DN2 and DN3/DN4 lymphoma subpopulations vs. LSK cells analysed by microarray with a q value cut-off < 0.01. e Signature enrichment plot comparing DN3 vs. DN1 lymphoma subpopulations for genes downregulated in CD133+ hematopoietic stem cells compared with CD133- cells (M6905 gene set) analysed by microarray. FDR q value = 0.027. f Heatmap comparing DN3 vs. DN1 lymphoma subpopulations for expression levels of genes downregulated in hematopoietic stem cells analysed by microarray. Color scale represents raw Z-score mRNA intensity values (red = high expression, blue = low expression).

