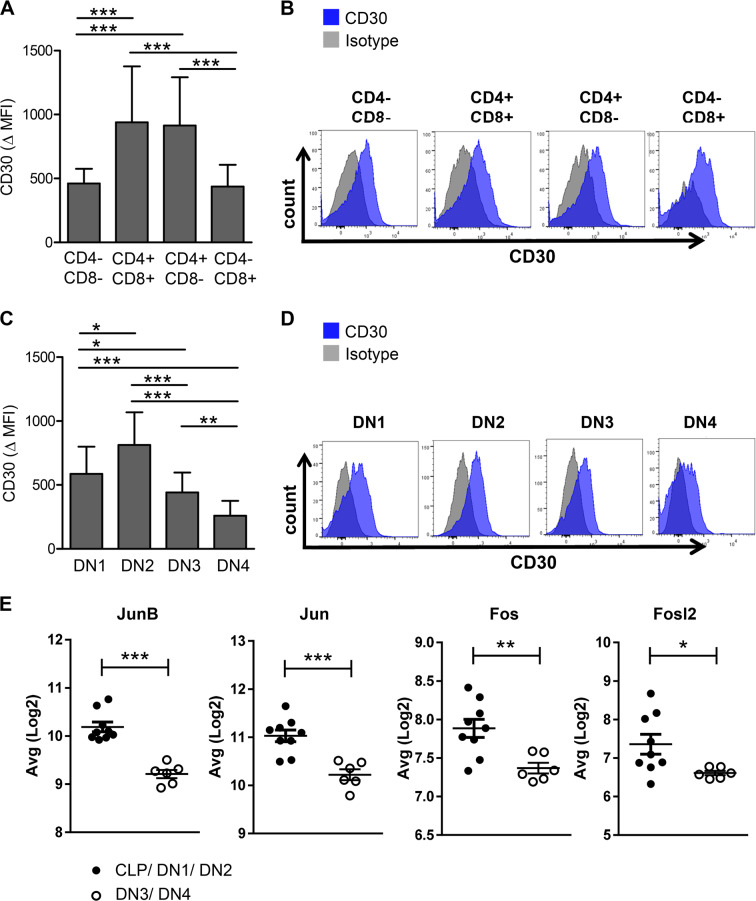
Fig. 6. The lymphoma stem cell population is characterized by low CD30 expression levels.
a CD30 expression levels of the indicated EGFP+ T cell subpopulations differentiated for CD4 and CD8 of lymphoma cells isolated from MSNAIE Lck-Cre transgenic BM transplanted mice. ∆ Mean fluorescence intensity (MFI) = MFI of anti-CD30 stained sample minus MFI isotype n = 14. b Representative flow cytometry histograms of EGFP+ lymphoma cells differentiated for CD4 and CD8 and stained for anti-CD30 isolated from MSNAIE Lck-Cre transgenic BM transplanted mice. c CD30 expression levels on the indicated EGFP+ T cell lymphoma subpopulations differentiated by DN stages isolated from MSNAIE Lck-Cre transgenic BM transplanted mice. ∆ Mean fluorescence intensity (MFI) = MFI of anti-CD30 stained sample minus MFI isotype n = 14. d Representative flow cytometry histograms of EGFP+ lymphoma cells of MSNAIE Lck-Cre transgenic BM transplanted mice differentiated by DN stages and stained for anti-CD30. e Gene expression levels for the indicated genes comparing CLP/DN1/DN2 and DN3/DN4 lymphoma subpopulations. n(CLP/DN1/DN2) = 9, n(DN3/DN4) = 6. *p < 0.05; **p < 0.01; ***p < 0.001. Data are represented as mean + SD.

