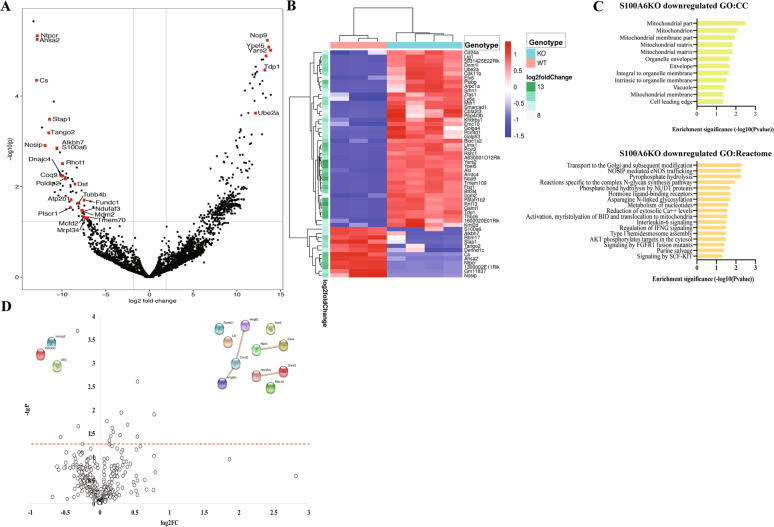
Fig. 3. Gene expression analysis shows that S100A6 null HSCs have reduced transcripts of genes that regulate intracellular calcium, Akt signaling, and mitochondria aerobic activity; differential protein expression between S100A6WT and KO HSCs indicates reduction of Hsp90 protein.
a Volcano plot of RNA-seq showing log fold change and negative logarithm of p values between WT and S100A6-deficient LT-HSC (CD150+CD48−CD34−Flt−). b Heatmap summarizing expression of 54 genes exhibiting differential expression between WT (pinkish-orange) and KO (light blue) at steady state. Samples are in the columns, genes in the rows, and the standardized expression levels are depicted by the color gradient: upregulated genes in red, downregulated genes in blue, adjusted p value < 0.2. c (above) Gene ontology enrichment analysis of cellular components for downregulated genes in S100A6-deficient samples. (Below) Gene ontology enrichment analysis of Reactome for downregulated genes in KO samples (accessed NetworkAnalyst 3.0). d Volcano plot of protein relative abundances between S100A6WT and KO at steady state. The X-axis shows the fold change in logarithmic scale. The Y-axis shows the log of the p value. Horizontal dashed line corresponds to p value = 0.05.

