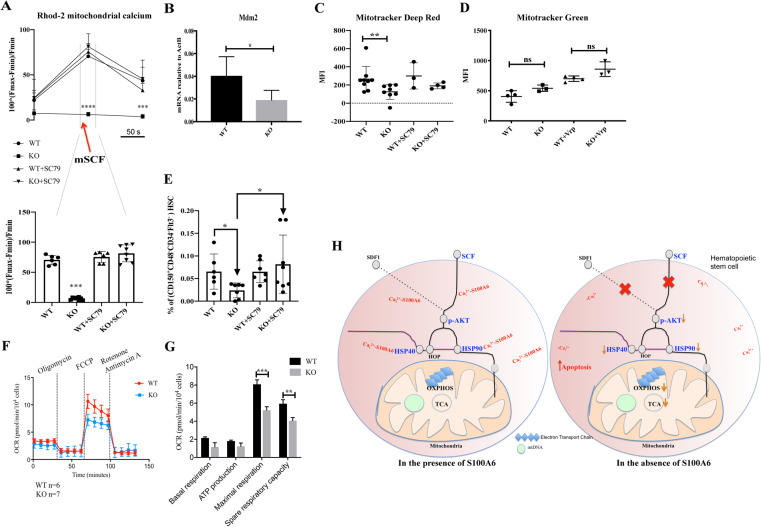
Fig. 7. S100A6 regulates mitochondrial calcium levels and mitochondrial respiratory capacity; Akt activator SC79 molecule restores S100A6KO LT-HSC compartment.
a (above) The corresponding change measured by Rhod-2 AM fluorescence intensity in mitochondrial calcium before, during, and after the stimulation with mSCF over 50 s, gated on CD150+CD48−CD34−Flt−. (below) Trace the period of mSCF application on Rhod-2 fluorescence and total samples that respond upon mSCF stimulation phase (WT, WT + SC79 n = 6; KO, KO + SC79 n = 8); *** or **** p < 0.0001; analyzed by multiple t-test (above); Mann–Whitney U test (below). b qRT-PCR analysis for Mdm2 mRNA expression and relative mRNA expression is normalized to ActB expression levels, and mean ± SD is shown (n = 6). Intracellular staining of Mitotracker deep red (c) and Mitotracker green (d) in S100A6WT and KO HSCs for 30 min and analyzed by flow cytometry gated on CD150+CD48−CD34−Flt−. c SC79 added on c-kit-enriched cells for 20 min at room temperature, before Mitotracker deep red staining. e Frequency of S100A6KO LT-HSC (LSK CD150+CD48−CD34−Flt3−) from total c-kit-enriched BM cells is restored after Akt activator SC79 treatment (*p < 0.05; analyzed by Mann–Whitney U test). f Oxygen consumption rate (OCR) trace was determined using a Seahorse XF96 Analyzer. g Maximum respiratory capacity and reserve respiratory capacity decreased in S100A6 null cells. *p < 0.05; * *p < 0.001; ***p < 0.000 as determined by multiple t-test. Bars represent mean ± SD (n = 7). h Summary of S100A6 regulation of mitochondria oxidative phosphorylation through Akt and Hsp90 interaction in mouse HSC. All data represent mean values from independent experiments ± SD. *p < 0.05, analyzed by unpaired t-test.

