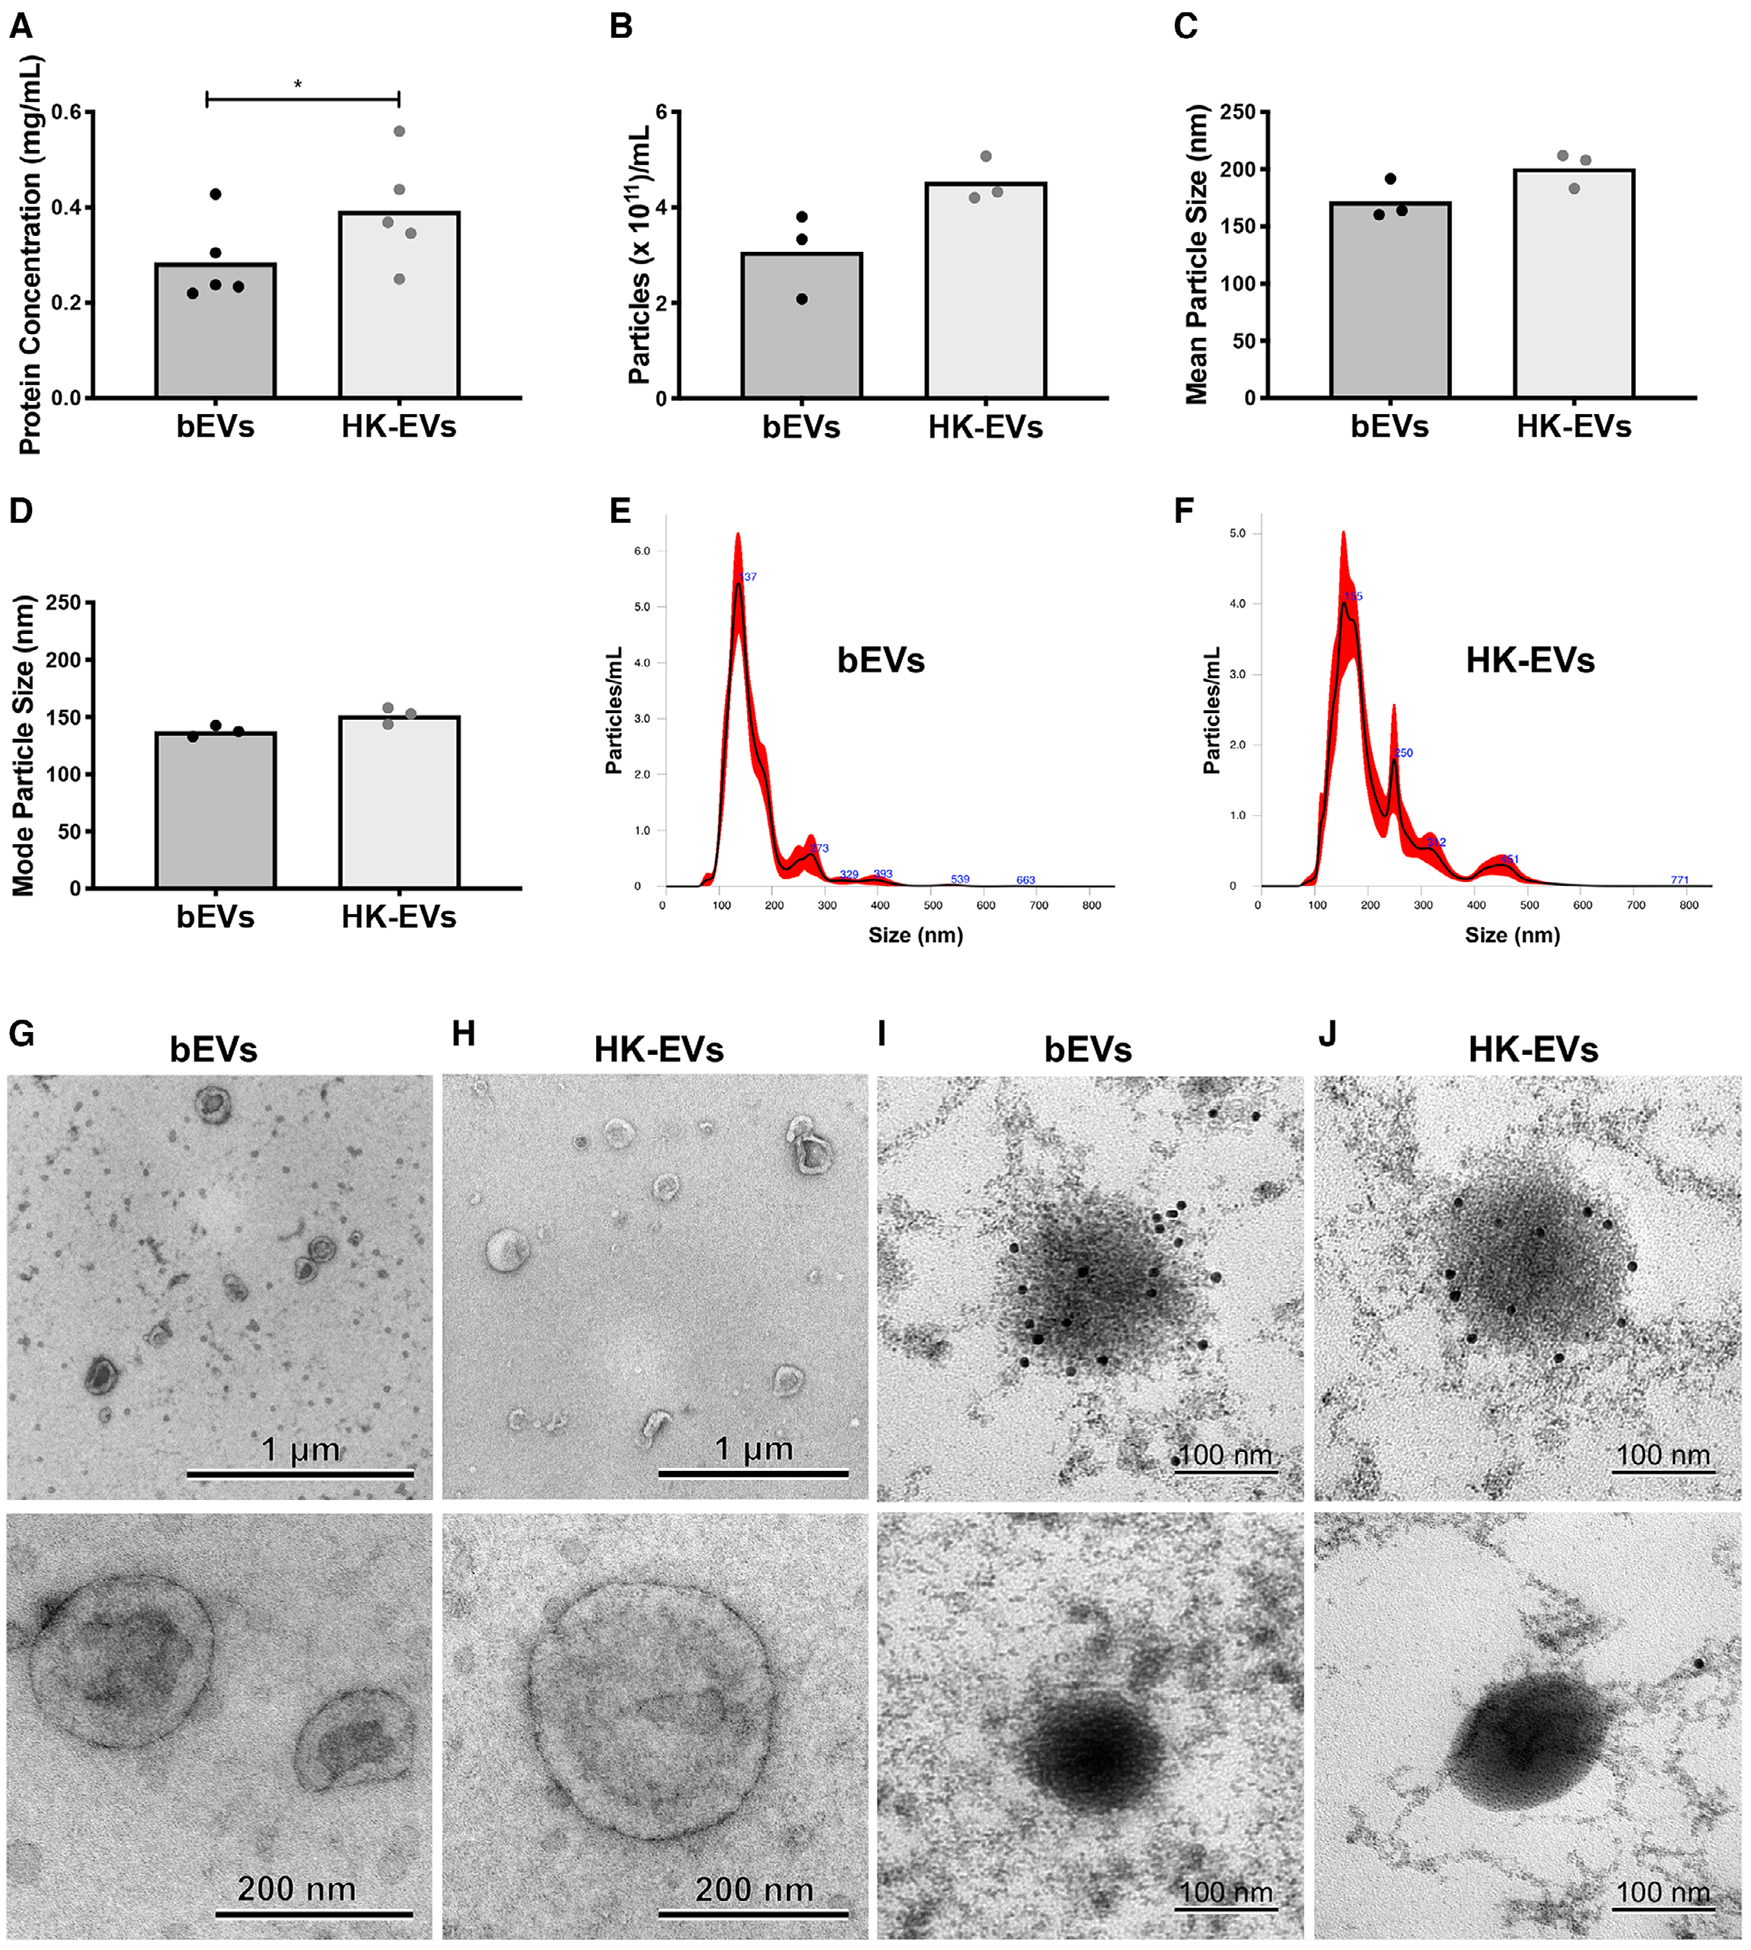
FIGURE 1. Viable bacteria are not required for extracellular vesicle (EV) biogenesis.

Protein concentration for the two EV subsets was determined by bicinchoninic acid (BCA) (A, n = 5). Nanoparticle tracking analysis (NTA) was used to determine particle concentration (B), mean particle size (C), and mode particle size (D) of EV samples (n = 3). Symbols represent individual data points and bars represent the mean. P-values were determined using a paired Student’s t-test (*P < 0.05). Representative histograms collected from NTA are shown in (E) and (F). Representative transmission electron microscopy micrographs are shown at 10,000× (top panels, scale bar = 1 μm) and 60,000× magnification (bottom panels, scale bar = 200 nm) for positive-negative stained bEV (G) and heat-killed EV (H) subsets (n = 3). For immunogold labeling, gp91 bound to primary antibody was labeled with secondary antibody-conjugated gold particles, then stained and visualized. Shown are representative images from two experiments (scale bar = 100 nm, I and J, top panels). In a single experiment, the primary antibody to gp91 was omitted to confirm specificity of immunogold staining (scale bar = 100 nm, I and J, bottom panels)
