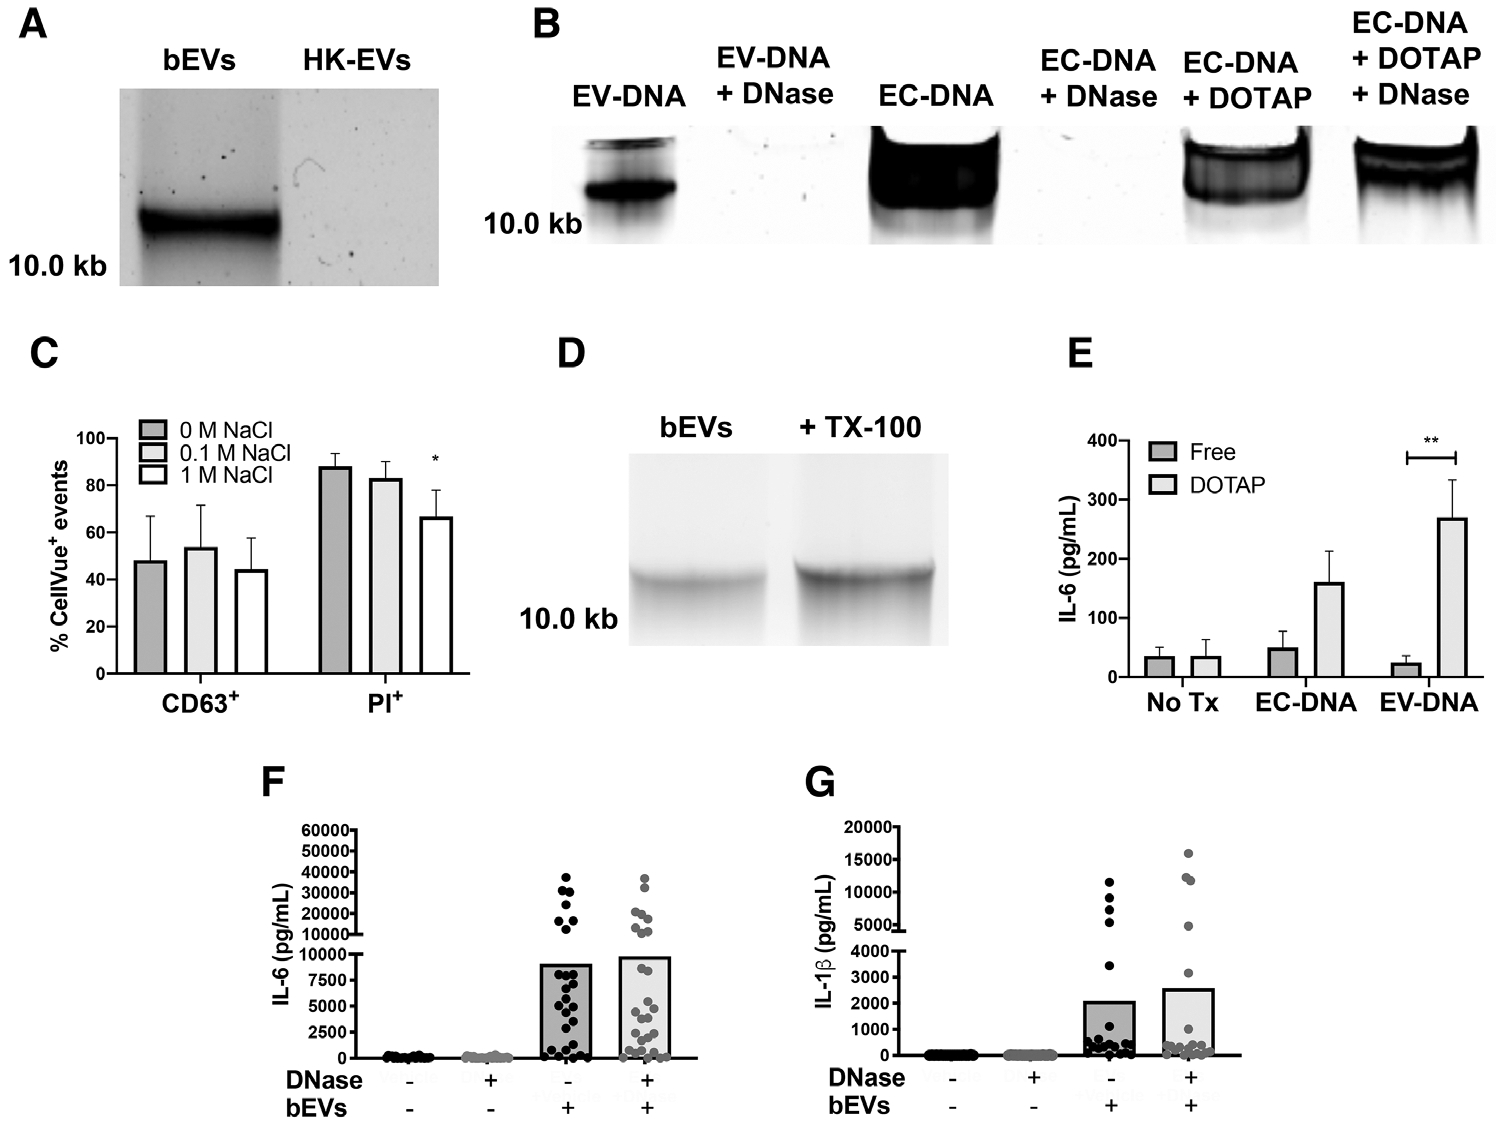
FIGURE 4. DNA is present and associated electrostatically with bEVs, but does not contribute significantly to IL-6 and IL-1β production.

DNA extracted from 50μL of bEVs and heat-killed extracellular vesicles (EVs) was separated by electrophoresis on a 0.7% agarose gel stained with Gel Red (n = 3, A). E. coli DNA (EC-DNA, 1 μg), bEVs, or EC-DNA encapsulated in DOTAP were treated with PBS or DNase I (5 units), then DNA was resolved by gel electrophoresis (n = 3, B). EVs were conjugated to beads, stained with CellVue, and then treated with 0 M, 0.1 M, or 1 M NaCl. After washing, EVs were then stained with either propidium iodide or CD63 and analyzed by flow cytometry (n ≥ 3, C). Bars represent average percentage of positive events ± SEM. P-values were determined for each group using a 1-way ANOVA and Dunnett’s posttest (*P < 0.05 vs. 0 M NaCl). Extracted DNA from untreated or lysed bEVs was assessed as described in A (n = 6, D). Macrophages were treated with either free or DOTAP-encapsulated purified EV-DNA or EC-DNA (1 μg/mL) for 18 h at 37°C before supernatants were analyzed by ELISA for IL-6 (E). Bars represent average values ± SEM (n = 3). P-values were determined for each group using a 2-way ANOVA and multiple comparisons posttest (**P < 0.01). bEVs (200 ng/mL) were incubated with either vehicle or DNase I (5 units) for 1 h at 37°C followed by DNase inactivation with 5 mM EDTA. Macrophages were treated with vehicle or manipulated bEVs for 18–20 h, then supernatants were collected and analyzed by ELISA for IL-6 (F) and IL-1β (G). Symbols represent individual data points, and bars represent the average of at least 24 experiments. P-values were determined using a 1-way ANOVA and Dunnett’s posttest (*P < 0.05 and **P < 0.01 vs. bEVs + vehicle)
