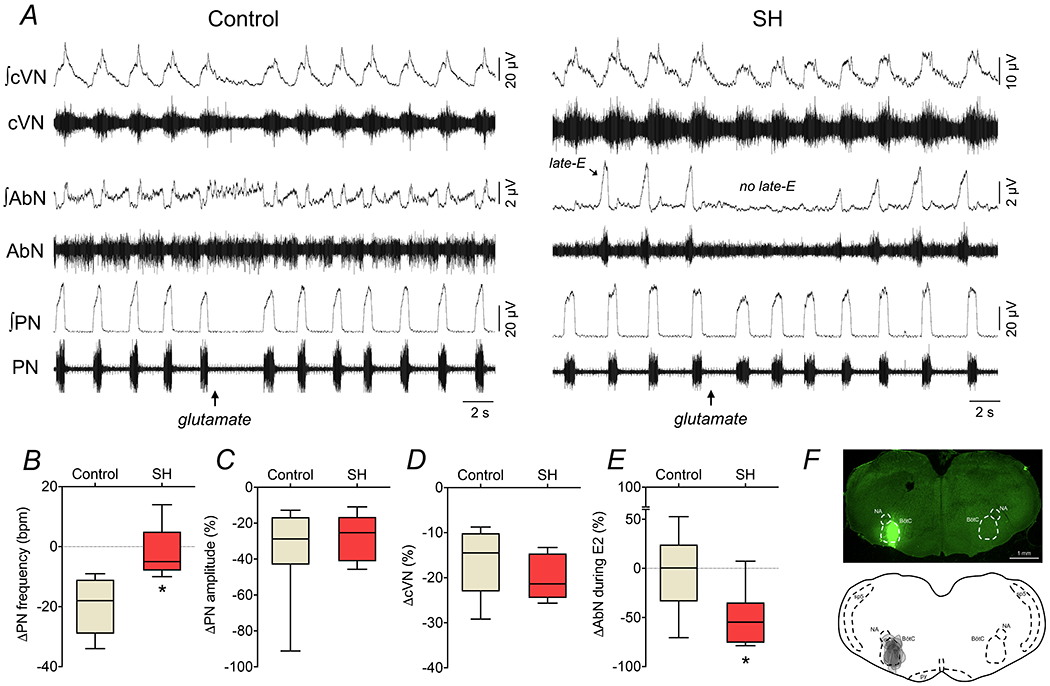
Figure 11. Respiratory motor responses to glutamatergic stimulation of BötC in control and SH rats.

Panel A: raw and integrated (∫) recordings of cervical vagus (cVN), abdominal (AbN) and phrenic (PN) nerve activities of control and SH in situ preparations, representative from their groups, illustrating the respiratory responses to unilateral L-glutamate microinjection (10 mM) in the BötC (arrow). Panels B-E: average changes in PN burst frequency and amplitude, cVN post-I and AbN E2 activities, respectively, in response to L-glutamate microinjections in the BötC of control (n=7) and SH (n=7) in situ preparations. * different from control group, P<0.05 (unpaired t test). Panel F: coronal section of brainstem from a in situ preparation, illustrating the site of unilateral microinjection in the BötC. The injection sites in each animal of the control and SH groups are represented as the grey area in the schematic drawing at the bottom.
