

Abstract
Objective
The purpose of this study was to determine whether baseline measures of hedonic hunger—the Power of Food Scale—and self‐control for food consumption—the Weight Efficacy Lifestyle Questionnaire—were associated with network topology within two sets of brain regions (regions of interest [ROIs] 1 and 2) in a group of older adults with obesity. These previously identified brain regions were shown in a different cohort of older adults to be critical for discriminating weight loss success and failure.
Methods
Baseline functional magnetic resonance imaging data (resting state and food cue task) were collected in a novel cohort of 67 older adults with obesity (65‐85 years, BMI = 35‐42 kg/m2) participating in an 18‐month randomized clinical trial on weight regain.
Results
The Power of Food Scale was most related to ROI 1, which includes the visual cortex and sensorimotor processing areas during only the food cue state. During both the food cue and resting conditions, the Weight Efficacy Lifestyle Questionnaire was associated with ROI 2, which includes areas of the attention network and limbic circuitry.
Conclusions
Our findings show critical, distinct links between brain network topology with self‐reported measures that capture hedonic hunger and the confidence that older adults have in resisting the consumption of food because of both intrapersonal and social/environmental cues.
Study Importance.
What is already known?
-
►
Obesity is associated with deleterious health effects in older adults.
-
►
We previously applied machine learning techniques to functional brain network data and found two sets of brain regions that were critical for discriminating weight loss success and failure with an accuracy greater than 95%.
What does this study add?
-
►
In a novel cohort of older adults with obesity undergoing a weight loss intervention, we found significant relationships between the organization of the two previously discovered brain networks and measures of food‐seeking behavior.
-
►
The Power of Food Scale was most related to a collection of brain regions that includes the visual cortex and sensory motor processing areas during only the food cue state, whereas during both the food cue and resting conditions, the Weight Efficacy Lifestyle Questionnaire was associated with a set of brain regions that includes areas of the attention network and limbic circuitry.
How might these results change the direction of research or the focus of clinical practice?
-
►
The hedonic desire to consume food and the ability to control consumption are highly variable and depend on individualistic experiences that are associated with the organization of specific brain networks.
-
►
More attention in research and clinical practice should be given to conditioned behavior and to the role of nonconscious processes in weight management.
Introduction
Our research group has been at the forefront of research on intentional weight loss in older adults (1, 2, 3, 4, 5), and consistent with data from large multicenter clinical trials of weight loss in middle‐aged adults (6), considerable variability in the amount of weight loss with treatment and eventual weight regain has been observed (7). In 2017, we completed an 18‐month weight loss intervention of older adults with obesity, a subset of whom (n = 65) underwent functional magnetic resonance imaging (fMRI) in the morning following an overnight fast (5). The brain scans were recorded during both the resting state and a food cue visualization task. Combining functional brain networks and machine learning, we were able to discriminate between those who either succeeded or failed to meet an 18‐month 5% weight loss criterion with an accuracy that exceeded 95% (8). We currently have an ongoing federally funded randomized clinical trial of weight regain following weight loss in older adults with obesity, and we received a supplement that enabled us to collect baseline fMRI data on a subset of the cohort at rest and during a food cue visualization task (n = 67) (9). The current study examines whether baseline measures of hedonic hunger—the Power of Food Scale (PFS) (10)—and a measure of control over eating—the Weight Efficacy Lifestyle (WEL) Questionnaire (11)—are associated with network organization in the very brain regions that were found to be critical for predicting weight loss in our prior work (8).
The PFS was developed by Lowe and colleagues as a measure of hedonic hunger (12) and was designed to assess the preoccupation with and desire to consume foods for the purpose of pleasure as opposed to hunger. Short‐term laboratory studies have shown that individuals who exhibit higher scores on the PFS display greater attentional bias to high‐calorie foods and more often choose unhealthy snacks; notably, these effects can be neutralized through cognitive distraction (13, 14). Prior neuroimaging research by our group with the PFS (15, 16) has shown that the functional brain networks of those scoring high and low on the measure differed in the resting state and during a food cue visualization task. Those scoring high, as opposed to low, on the PFS had greater local efficiency within the visual cortex and greater community structure in the sensorimotor circuit when imagining desired food, irrespective of whether they were in a fasted or fed state (15, 16).
The WEL Questionnaire, developed by Clark and colleagues, is a measure of the ability to resist or control eating in different personal states or social/environmental contexts (11). Both baseline WEL scores (17) and change with treatment (18, 19, 20) have been predictive of weight loss, with Rejeski and colleagues (20) finding that change in WEL scores during the early, intensive phase of treatment partially mediated the 18‐month treatment effect on weight loss.
In the current study, using cross‐sectional data from baseline assessments, we examine whether scores on the PFS and WEL of older adults with obesity are related to network organization of the two regions of interest (ROIs) that were most influential in our prior predictive analyses (Supporting Information Figure S1). ROI 1 includes the cerebellum, lateral sensorimotor areas, posterior insula, and midanterior cingulate cortex, as well as the early visual cortex, and thus it would be expected to be most relevant to the PFS scale (16, 20). Because participants were instructed to view a cross on a screen during the resting state scan and then words of favorite foods during the visualization task, we predicted that the PFS would have little relationship to network metrics calculated in the resting state, whereas it would have a strong relationship to network metrics during the visualization task. Because the network topological metrics clustering coefficient (CC) and global efficiency (GE) give clues about information processing and functional network topology, we hypothesized a more small‐world topology for those scoring higher on the PFS and a more segregated lattice‐like topology in those scoring lower on the PFS.
ROI 2 includes bilateral frontal and parietal areas known to be integral to the executive attention network and components of the hedonic/goal‐directed network, including the amygdala, temporal pole, hippocampus, fusiform gyrus, and inferior insula. Because we had previously postulated that ROI 2 represents the process of top‐down control that the attention network projects onto the limbic regions, we expected that this region would be most strongly related to WEL scores. Given recent work by Chen and colleagues (21), we further hypothesized that the WEL would be related to network organization in these regions in both the resting state and food visualization task; nonetheless, we expected the relationship to be the strongest during the visualization task. As such, we hypothesized that individuals scoring lower on the WEL—those with worse executive control over food—would have a more distributed small‐world network topology in ROI 2 when viewing food and a more lattice‐like segregated topology during rest.
Methods
Participants
A sample (n = 71) of older adults with obesity were recruited from a weight regain study, Empowered with Movement to Prevent Obesity and Weight Regain (EMPOWER) (9). All eligible and willing EMPOWER participants without contraindications for an MRI scan completed an in‐person screening visit and a 45‐minute MRI scan after an overnight fast. MRI data were collected at baseline before participants initiated any treatment. Of the 71 participants who consented (57 females and 14 males), the final sample included 67 participants because of complications with the imaging process. This study protocol was approved by the Wake Forest School of Medicine Institutional Review Board.
Overview of the EMPOWER study
Inclusionary criteria for EMPOWER included: age 65 to 85 years, BMI between 35 and 42 kg/m2, and sedentary lifestyle, which is defined as engaging in less than 20 minutes of aerobic exercise per day (9). Participants were excluded if they had evidence of cognitive impairment as determined at screening using the Montreal Cognitive Assessment (22). See Fanning and colleagues (9) for detailed descriptions of the methods.
Measures
Power of Food scale
The PFS assesses the drive to consume highly palatable foods in an obesogenic environment, with higher scores associated with higher drive (12). We used the total score of the PFS as this score has been shown to have good test‐retest reliability (r = 0.77), internal consistency (α = 91), and existing support for its construct validity (12). For example, in a comprehensive review, Espel‐Huynh and colleagues (23) reported that individuals with high PFS scores attend more readily to highly palatable foods, a shift in attention that is accompanied by increased activation in areas of the brain known to be related to eating behavior. Additionally, within the context of weight loss interventions, the magnitude of reduction in PFS scores with treatment has been found to be directly related to the amount of weight lost (24, 25).
WEL Questionnaire
The WEL measures confidence in one’s ability to resist consuming food in the presence of negative emotions and in situations with increased food availability and social pressure (11). Higher scores are associated with higher coping ability. Previous work (26) reinforced the excellent internal consistency reliability of the WEL total score, Cronbach α = 0.95 (27), with support for construct validation demonstrating that people with obesity with low scores are at risk for disordered patterns of eating, including binging, food addiction, and night‐eating syndrome (27). In a clinical trial of weight loss with older adults, we found that change in the WEL total score from baseline to 6 months was predictive of lost weight assessed at 18 months (20).
Procedure for the MRI ancillary study
Initial in‐person visit
Documented consent was obtained for this ancillary study, and MRI compatibility information was gathered. Participants also named their four favorite foods for use in the MRI scanning protocol.
MRI scanning visit: resting and food cue states
Participants arrived in the morning having fasted from food for at least 8 hours. The MRI scan session included two separate fMRI conditions: a resting state and a food cue visualization task. During the resting state, participants were instructed to keep their eyes open and focus on an on‐screen fixation cross for 6 minutes. During the food cue visualization task, participants viewed the words of their favorite food items. As each word was presented in 30‐second intervals for a total of 6 minutes, participants were instructed to imagine the taste, the smell, and the satisfaction of consuming the food.
MRI scanning protocol and functional brain network generation
See Methods in the online Supporting Information.
Brain regions of interest
This study examined the network properties of two functionally defined ROIs found to be predictive of weight loss in older adults with obesity (8). These ROIs were within the context of the Shen functional atlas (28) (Supporting Information Figure S1 and Table S9).
Statistical analysis by mixed‐effects modeling and associated covariates
We used a mixed‐modeling framework in order to understand how PFS, WEL, and baseline connection strength were associated with topological network characteristics within two functionally defined ROIs. We used continuous scores of the PFS and WEL in our models. This two‐part model examines the probability (presence or absence) of network connections as well as the strength of existing connections (29, 30). For the scope of this study, we focused solely on the strength of the network connections. Negative correlations (connection strength) were set to 0 because the model includes graph features that are not applicable with negative connections (29). All connection strength results for each condition are provided in the online Supporting Information (Tables S1‐S4), as well as a description of the probability findings (Supporting Information Tables S5‐S8). This multivariate regression framework calculated the relationship between connection strength as the outcome (dependent) variable and network and nonnetwork covariates (including interactions between the two sets) as the independent variables. The model included average CC and average GE as network variables (31). Age, sex, race, and BMI were included in the model as covariates to control for any association with network organization. To account for potential effects of participants’ brain sizes, the spatial Euclidian distance and squared distance between network nodes were included as confounding variables (32). For discussion of statistical power for this approach, see Methods in the online Supporting Information.
Planned post hoc analysis
To follow up on significant interactions in the model, further post hoc analyses were performed. Specifically, we applied appropriate contrast statements to the regression analyses to examine the interactions between the PFS or WEL and the network topological feathers (CC and GE) within the ROIs. These post hoc analyses enabled us to determine whether the PFS and WEL contributed to statistically significant interactions by estimating the contrast statements of already estimated residuals for corresponding parameters.
Results
Table 1 displays demographic information and variables of interest included in the statistical model. Participant average age was 70.8 years with an average BMI of 35.3 kg/m2. Scores on either the PFS or WEL did not differ by sex. For the PFS, only ROI 1 results are shown because there were no significant findings for ROI 2, whereas for the WEL, we discuss only ROI 2 because there were no significant effects for ROI 1 (see Supporting Information Tables S1‐S4 and Results in the online Supporting Information for a complete set of model results).
TABLE 1.
Participant demographics and measures
| Variable | Overall (n = 67) | Male (n = 13) | Female (n = 54) |
|---|---|---|---|
| Age (y), mean (SD) | 70.8 (4.6) | 70.7 (5.3) | 70.8 (4.5) |
| BMI (kg/m2), mean (SD) | 35.3 (3.4) | 35.4 (3.2) | 35.3 (3.4) |
| Race, n (%) | |||
| African American or Black | 18 (26.9) | 1 (7.7) | 17 (31.5) |
| Hispanic | 1 (1.5) | 0 | 1 (1.9) |
| White | 48 (71.6) | 12 (92.1) | 36 (66.7) |
| Behavioral measures, mean (SD) | |||
| Power of Food Scale (PFS) | 2.60 (0.88) | 2.31 (0.85) | 2.68 (0.88) |
| Weight Efficacy Lifestyle (WEL) | 107.3 (28.5) | 104.8 (22.5) | 107.9 (29.9) |
PFS results
Food cue visualization
As hypothesized, significant three‐way interactions between GE*PFS*ROI 1 and CC*PFS*ROI 1 on connection strength illustrate that the PFS affected the relationships between connection strength and our network variables of interest (GE and CC) significantly more within ROI 1 compared with the remainder of the brain (Table 2). Results for the contrasts (Table 3) indicate that the PFS significantly altered the relationship between connection strength and both network variables. This interaction was positive for GE, indicating that the relationship between GE and connection strength was greater in those with higher PFS scores. For CC, the interaction was negative, indicating that the relationship between CC and connection strength was lower in those individuals with higher PFS scores.
TABLE 2.
Regression results for PFS
| Estimate (β) | SE | t‐score | P value | |
|---|---|---|---|---|
| Food cue state | ||||
| PFS | 0.00449 | 0.004224 | 1.06 | 0.2876 |
| ROI 1 | 0.04584 | 0.001180 | 38.84 | <0.0001 |
| PFS*ROI 1 | 0.00133 | 0.001181 | 1.13 | 0.2586 |
| GE | 0.03368 | 0.000991 | 33.98 | <0.0001 |
| GE*PFS | −0.00063 | 0.000990 | −0.64 | 0.5231 |
| GE*ROI 1 | 0.02908 | 0.002461 | 11.81 | <0.0001 |
| GE*PFS*ROI 1 | 0.01329 | 0.002599 | 5.11 | <0.0001 |
| CC | 0.07362 | 0.001020 | 72.21 | <0.0001 |
| CC*PFS | 0.00066 | 0.001018 | 0.65 | 0.5174 |
| CC*ROI 1 | −0.00673 | 0.002388 | −2.82 | 0.0048 |
| CC*PFS*ROI 1 | −0.01089 | 0.002488 | −4.37 | <0.0001 |
| Resting state | ||||
| PFS | −0.00439 | 0.004518 | −0.97 | 0.3317 |
| ROI 1 | 0.04515 | 0.001218 | 37.07 | <0.0001 |
| PFS*ROI 1 | −0.00177 | 0.001208 | −1.46 | 0.1437 |
| GE | 0.03344 | 0.001150 | 29.09 | <0.0001 |
| GE*PFS | −0.00048 | 0.001149 | −0.42 | 0.6732 |
| GE*ROI 1 | 0.02354 | 0.002636 | 8.93 | <0.0001 |
| GE*PFS*ROI 1 | −0.00073 | 0.002709 | −0.27 | 0.7870 |
| CC | 0.07691 | 0.001154 | 66.67 | <0.0001 |
| CC*PFS | −0.00031 | 0.001156 | −0.27 | 0.7857 |
| CC*ROI 1 | −0.00151 | 0.002518 | −0.60 | 0.5480 |
| CC*PFS*ROI 1 | −0.00224 | 0.002545 | −0.88 | 0.3779 |
Results are for network strength and include analyses for ROI 1. Main hypothesized interactions are highlighted in gray with significant effects bolded. Asterisks denote interaction between variables.
CC, clustering coefficient; GE, global efficiency; PFS, Power of Food Scale; ROI, region of interest 1.
TABLE 3.
Post hoc findings on topological characteristics of ROI 1 driven by PFS during food cue state
| Estimate (β) | SE | t‐score | P value | |
|---|---|---|---|---|
| GE*PFS within ROI 1 | 0.01266 | 0.002738 | 4.62 | <0.0001 |
| CC*PFS within ROI 1 | −0.01023 | 0.002644 | −3.87 | 0.0001 |
Significant effects bolded.
CC, clustering coefficient; GE, global efficiency; PFS, Power of Food Scale; ROI 1, region of interest.
Figure 1 illustrates the significant three‐way interaction for GE*PFS*ROI 1. Because the PFS is a continuous variable, the actual plots of this interaction would be three‐dimensional planes and difficult to visualize. Therefore, although continuous data were used for the actual statistical model, we used the upper and lower bounds of the PFS distribution to create individual lines representing the relationship at higher and lower PFS scores. It is clear from Figure 1A that there was no difference in the relationship between GE and connection strength for different PFS scores in the brain areas outside ROI 1 because the slopes are similar for blue and green lines. However, significant effects of the PFS on GE in ROI 1 are supported by the slope for those with higher PFS (yellow line) than lower PFS scores (red line). Figure 1C shows the relationship between connection strength, CC, and PFS within ROI 1 and for the remainder of the brain. Clearly, there is no difference in the slope for those with higher and lower PFS scores in the regions outside ROI 1 (blue and green lines). The significant interaction of the PFS and CC within ROI 1 is depicted by the shallow slope for higher PFS scores (yellow line) relative to lower PFS scores (red line) and relative to both the higher and lower PFS scores outside ROI 1.
Figure 1.
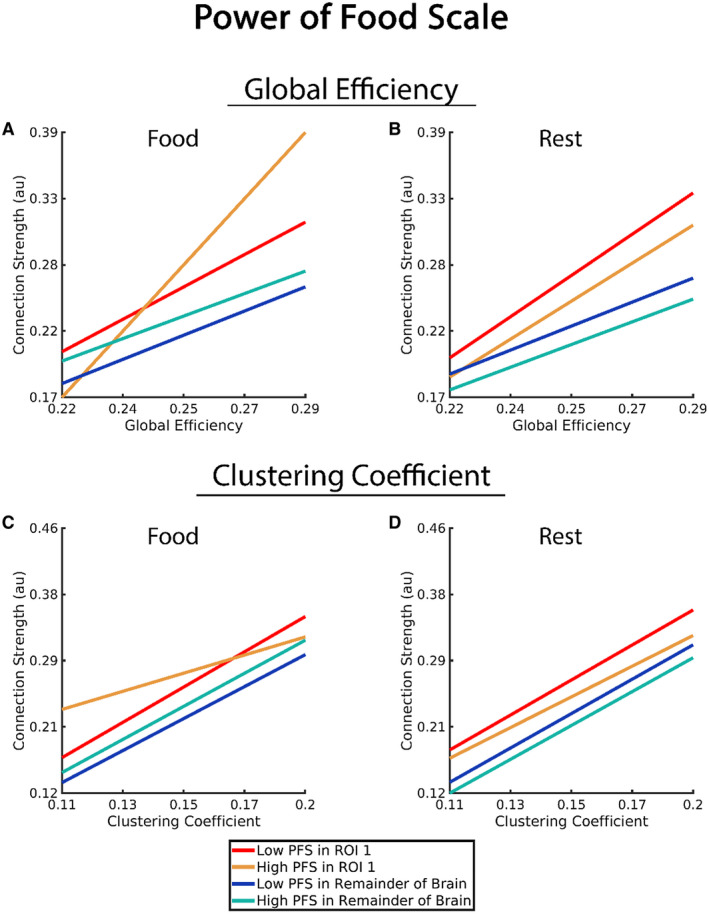
Association of connection strength, network variable (global efficiency and clustering coefficient), Power of Food Scale (PFS), and ROI 1 in comparison with connection strength of the remainder of the brain (all brain regions outside of ROI 1). Note that the PFS is a continuous variable, and the statistical analyses used the continuous variable in the model. However, to help clarify the statistical findings, we used upper and lower bounds of the scores to create a generalized representation of those with higher and lower PFS scores (“High PFS” and “Low PFS” in the graphs). [Color figure can be viewed at wileyonlinelibrary.com]
Resting state
A key difference for the resting state compared with the food cue visualization task was that the hypothesized interaction of GE*PFS*ROI 1 did not achieve significance. These outcomes are shown pictorially in Figure 1B. Although the slopes of the red and yellow lines differ from the slopes of the blue and green lines, consistent with the significant GE*ROI 1 interaction, the slopes of the red‐yellow and blue‐green line pairs are similar because the GE*PFS*ROI 1 interaction was not significant. In addition, the three‐way interaction of interest for CC (CC*PFS*ROI 1) was not significant (Figure 1D).
WEL Questionnaire
Food cue visualization task
The main hypothesized interactions (GE*WEL*ROI 2 and CC*WEL*ROI 2) were significant, indicating that the interaction between GE and CC with the WEL was stronger in ROI 2 than the remainder of the brain (Table 4). The results for the contrasts (Table 5) indicate that the WEL significantly altered the relationship between connection strength and both network variables within ROI 2 during the food cue condition. The interaction was negative for GE, indicating that the relationship between GE and connection strength was lower in those individuals with higher WEL scores. For CC, the interaction was positive, indicating that the relationship between CC and connection strength was higher in those individuals with higher WEL scores.
TABLE 4.
Regression results for WEL
| Estimate (β) | SE | t‐score | P value | |
|---|---|---|---|---|
| Food cue state | ||||
| WEL | −0.00893 | 0.003915 | −2.28 | 0.0225 |
| ROI 2 | 0.02956 | 0.001413 | 20.91 | <0.0001 |
| WEL*ROI 2 | 0.00173 | 0.001467 | 1.18 | 0.2384 |
| GE | 0.03482 | 0.001010 | 34.48 | <0.0001 |
| GE*WEL | −0.00077 | 0.001009 | −0.76 | 0.4460 |
| GE*ROI 2 | 0.01295 | 0.002948 | 4.39 | <0.0001 |
| GE*WEL*ROI 2 | −0.00915 | 0.002975 | −3.07 | 0.0021 |
| CC | 0.07309 | 0.001051 | 69.51 | <0.0001 |
| CC*WEL | −0.00061 | 0.001052 | −0.58 | 0.5611 |
| CC*ROI 2 | 0.01196 | 0.002720 | 4.40 | <0.0001 |
| CC*WEL*ROI 2 | 0.00783 | 0.002502 | 3.13 | 0.0018 |
| Resting state | ||||
| WEL | −0.00529 | 0.004342 | −1.22 | 0.2228 |
| ROI 2 | 0.02579 | 0.001470 | 17.55 | <0.0001 |
| WEL*ROI 2 | 0.00212 | 0.001475 | 1.44 | 0.1502 |
| GE | 0.03495 | 0.001097 | 31.85 | <0.0001 |
| GE*WEL | 0.00046 | 0.001095 | 0.42 | 0.6774 |
| GE*ROI 2 | −0.00294 | 0.003163 | −0.93 | 0.3530 |
| GE*WEL*ROI 2 | 0.01519 | 0.003343 | 4.54 | <0.0001 |
| CC | 0.07599 | 0.001138 | 66.79 | <0.0001 |
| CC*WEL | −0.00162 | 0.001133 | −1.43 | 0.1535 |
| CC*ROI 2 | 0.02279 | 0.003028 | 7.53 | <0.0001 |
| CC*WEL*ROI 2 | −0.01512 | 0.003241 | −4.67 | <0.0001 |
Results are for network strength and include analyses for ROI 2. Main hypothesized interactions are highlighted in gray with significant effects bolded. Asterisks indicate interactions between variables.
CC, clustering coefficient; GE, global efficiency; ROI 2, region of interest 2; WEL, Weight Efficacy Lifestyle Questionnaire.
TABLE 5.
Post hoc findings on topological characteristics of ROI 2 driven by WEL for food cue visualization state and resting state
| Estimate (β) | SE | t‐score | P value | |
|---|---|---|---|---|
| Food cue state | ||||
| GE*WEL within ROI 2 | −0.00992 | 0.003109 | −3.19 | 0.0014 |
| CC*WEL within ROI 2 | 0.00722 | 0.002681 | 2.69 | 0.0071 |
| Resting state | ||||
| GE*WEL within ROI 2 | 0.01565 | 0.003487 | 4.49 | <0.0001 |
| CC*WEL within ROI 2 | −0.01673 | 0.003401 | −4.92 | <0.0001 |
Significant effects bolded.
CC, clustering coefficient; GE, global efficiency; ROI 2, region of interest 2; WEL, Weight Efficacy Lifestyle Questionnaire.
Figure 2 illustrates these interactions (GE and CC with WEL in ROI 2). As with the PFS, the WEL was used as a continuous variable in the statistical model, but we used the upper and lower bounds of the distribution to create plots to visualize the relationship for higher and lower WEL scores. Figure 2A and 2C graphically depict the significant WEL findings during the food visualization task for GE and CC, respectively. For both network variables, the lack of interaction with the WEL in areas outside ROI 2 is evident by the blue and green lines that have highly similar slopes in each graph. For GE, the negative three‐way interaction (GE*WEL*ROI 2) resulted in a steeper slope for the lower WEL scores (red line) than for the higher WEL scores (yellow line). This indicates that the connection strength increases that were associated with increases in GE were greater for those with lower WEL scores but only in ROI 2. For CC, the three‐way interaction (CC*WEL*ROI 2) was positive. This is illustrated in Figure 2C by the steeper slope of those with higher WEL scores (yellow line), as connection strength rapidly increased as CC increased for higher WEL scores compared with lower WEL scores (red line).
Figure 2.
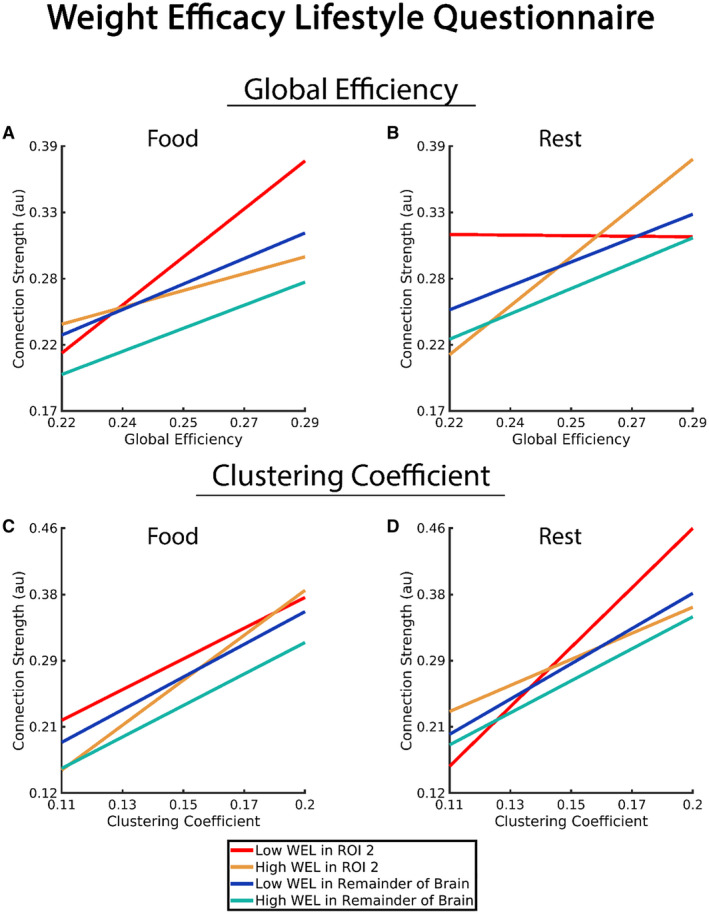
Association of connection strength, network variable (global efficiency and clustering coefficient), Weight Efficacy Lifestyle Questionnaire (WEL), and ROI 2 in comparison with connection strength of the remainder of the brain (all brain regions outside of ROI 2). Note that the WEL is a continuous variable, and the statistical analyses used the continuous variable in the model. However, to help clarify the statistical findings, we used upper and lower bounds of the scores to create a representation of those with higher and lower WEL scores (“High WEL” and “Low WEL” in the graphs). [Color figure can be viewed at wileyonlinelibrary.com]
Resting state
The hypothesized three‐way interaction (GE*WEL*ROI 2) was significant, indicating that the interaction between GE and the WEL was stronger in ROI 2 than in the remainder of the brain (Table 4). CC exhibited a significant main effect and a significant interaction with ROI 2 but not with the WEL. As with GE, the hypothesized three‐way interaction (CC*WEL*ROI 2) was significant, indicating that the interaction between CC and the WEL was also stronger in ROI 2 than in the remainder of the brain.
Contrasts were used to determine the strength and direction of the WEL effect in ROI 2 for the resting state (Table 5). WEL scores significantly altered the relationship between connection strength and both network variables within ROI 2 during the resting state, but the direction of these effects was opposite of those observed during the food cue state. The interaction was positive for GE, indicating the relationship between GE and connection strength was higher in those individuals with higher WEL scores. The interaction for CC was negative, indicating that the relationship between CC and connection strength was lower in those individuals with higher WEL scores.
Figure 2B and 2D graphically demonstrate the findings for the resting state. For both GE and CC, the slopes for individuals with higher (green line) and lower (blue line) WEL scores are similar in the brain regions outside ROI 2. In ROI 2, GE exhibited the strongest relationship with connection strength for higher WEL scores (yellow line). For lower WEL scores, the slope of the line becomes negative, indicating that as GE increased the connection strength decreased. For CC in ROI 2, lower WEL scores were associated with a steeper slope (red line). Higher WEL scores (yellow line) exhibited a relationship comparable with areas outside ROI 2.
Discussion
In line with our first hypothesis, PFS scores of older adults with obesity were strongly related to ROI 1 during the food cue visualization task, whereas there was no relationship of the PFS to ROI 1 during the resting state. Interestingly, whereas the PFS was unrelated to ROI 2, as hypothesized, the WEL was related to ROI 2 both in the resting state and during the cue visualization task. The results for ROI 1, supported by our prior research (15, 16), underscore that the psychological construct assessed by the PFS has its origin in complex interactions between multiple brain regions that are activated during visualization of desired food cues. This network involves both unconscious—sensory, motor, cognitive, and affective processes that are likely responsible for the intrusive quality of food craving—and conscious cognitive and affective processes that serve to elaborate on these intrusive cues that fuel the desire for food consumption, a position consistent with Kavanagh’s Elaborated Intrusion Theory of Desire (33). ROI 1 is a network dominated by interactions between the cerebellum, lateral sensorimotor areas (including face, mouth, and throat), posterior insula, and midanterior cingulate cortex, as well as the early visual cortex (8).
As we have previously postulated, ROI 2 captures top‐down control that the attention network projects onto limbic regions known to be important in goal‐oriented behavior (34, 35). It encompasses a bilateral interacting pattern between the executive attention network and hedonic/goal‐directed network including the amygdala, hippocampus, and inferior insula (8). Prior research has shown that these limbic regions are implicated in the obesity epidemic (36). Droutman et al. (37), consistent with work by others (38, 39), argued that the anterior insula is an integrative interoceptive site connecting autonomic, affective, and cognitive processing. Altered connectivity within this network ROI could adversely affect inhibitory control leading to behavioral dysregulation (40), processes that are highly relevant to the construct assessed by the WEL (27).
It is important to understand the neuroscientific implication of the associations of network topology between the PFS and WEL. As indicated, the PFS was closely associated with connectivity of ROI 1. In the food cue condition, as PFS scores increased, the nodes with high CC had relatively weaker connections, whereas the nodes with high GE had relatively stronger connections. In such a situation, the high CC nodes would form distinct but weakly connected clusters. These clusters would coexist with strongly interconnected nodes with high GE. This is a so‐called small‐world topology (41) that supports regional and distributed information processing. As PFS scores decreased, the nodes with high CC became more strongly interconnected; in addition, the links between the nodes with high GE became weaker. Thus, when the lower PFS participants observed food cues, they had a more lattice‐like communication pattern, which would lead to more information segregation with only limited integration across the network.
Interestingly, the slopes of the low PFS participants in these graphs within ROI 1 are like the slopes in these low PFS participants in the remainder of the brain, and the slopes do not change substantially between rest and food cues. It is the slope changes within the participants with high PFS when confronted with food cues that drive the statistically significant findings. Research in the field of weight management in middle‐aged and older adults has observed that reductions in PFS scores with treatment are related to the use of weight control strategies (25) and that the magnitude of change in PFS scores is related to the amount of weight lost with treatment (24).
The statistically significant associations between the WEL, network variables, and presentation state were within ROI 2, unlike the PFS whose significant relationships were in ROI 1. Also, unlike the PFS, findings for the WEL measure included significant associations in both the food cue and resting states. However, the direction of the effects of the WEL in ROI 2 depended on condition. In the rest condition, the participants with low WEL scores were in a more lattice‐like configuration with segregation of information compared with the participants with high WEL scores. However, when presented with food cues, the network characteristics in ROI 2 flipped in the participants with low WEL scores, showing small‐world topology compared with the participants with high WEL scores. Existing research with the WEL has observed improvement in cognitive control with weight loss treatment programs among younger, middle‐aged, and older adults with obesity (18, 19, 20), with a clinical study of sleeve gastrectomy among middle‐aged and older adults with obesity showing that change in WEL scores from presurgery to 16 weeks postsurgery predicted weight regain 4.5 years later (42).
In a recent review of the PFS (23), Espel‐Huynh and colleagues suggested that the PFS is related to disordered eating as found with binging and weight cycling. It is important to underscore that both the PFS and WEL tap into constructs involved in conscious processing. Because we have emphasized that behavior change in aging involves both conscious and nonconscious processes (43), a position strongly supported by our network analyses (8), we hypothesize that data from baseline fMRI scans collected during both the resting state and the food cue visualization task will predict weight cycling and weight regain over and above data from the PFS and WEL. Because both the PFS and WEL have been shown to be responsive to behavioral weight loss (18, 20, 24, 25) across life‐spans, future research should examine both behavioral and pharmacological approaches to modifying activity in the ROIs that we have identified as central to weight loss in older adults (8), as well as whether targeting unconscious processes in the treatment of obesity (44) is essential for those who struggle with disordered eating because of the motivational power of food and poor top‐down control essential to self‐regulation in an obesogenic environment.
This study is not without limitations. These data are cross‐sectional and can be generalized only to older adults who have obesity and are free of cognitive impairment. Furthermore, limitations in the sample size did not permit us to explore differences as a function of either sex or race. Notwithstanding these limitations, the results of this study represent a growing segment of the older adult population that contains valid candidates for weight loss because of the presence of multiple comorbid conditions.
Conclusion
The current study is both novel and innovative in that we employed two ROIs, those with the most influence in our prior predictive analyses of long‐term weight loss, to investigate their relationship with the PFS and WEL. These analyses were conducted on an independent, broader sample of older adults with obesity involved in an ongoing study of weight regain. Clearly, each construct has critical links to distinct brain network topology. The results reinforce the fact that both the motive to pursue food and the ability to cope with the social/environmental determinants of eating behavior involve complex conscious and nonconscious processes that involve communication across multiple regions of the brain. Of note, nonconscious processes have been given scant attention in the behavioral treatment of obesity.
Funding agencies:
This study was supported by the National Institute on Aging (R01 AG051624‐03S2), National Heart, Lung, and Blood Institute (R18 HL076441), the Translational Science Center of Wake Forest University and the National Institute on Aging (P30 AG021332), the National Institute of Biomedical Imaging and Bioengineering (R01 EB024559), and the Wake Forest Clinical and Translational Science Institute (UL1 TR001420).
Disclosure
The authors declared no conflict of interest.
Author contributions
JHB, BJN, JF, and WJR designed the experiments. JHB, LLM, BJN, JF, and WJR performed the research. JHB, PJL, LLM, SLS, and MB analyzed the data. JHB, PJL, LLM, MB, and WJR wrote the paper.
Clinical trial registration
ClinicalTrials.gov identifier NCT02923674.
Supporting information
Supplementary Material
References
- 1. Messier SP, Loeser RF, Miller GD, et al. Exercise and dietary weight loss in overweight and obese older adults with knee osteoarthritis: The Arthritis, Diet, and Activity Promotion Trial. Arthritis Rheum 2004;50:1501‐1510. [DOI] [PubMed] [Google Scholar]
- 2. Nicklas BJ, Ambrosius W, Messier SP, et al. Diet‐induced weight loss, exercise, and chronic inflammation in older, obese adults: a randomized controlled clinical trial. Am J Clin Nutr 2004;79:544‐551. [DOI] [PubMed] [Google Scholar]
- 3. Nicklas BJ, You T, Pahor M. Behavioural treatments for chronic systemic inflammation: effects of dietary weight loss and exercise training. CMAJ 2005;172:1199‐1209. [DOI] [PMC free article] [PubMed] [Google Scholar]
- 4. Rejeski W, Bribaker P, Goff D, et al. Translating weight loss and physical activity programs into the community to preserve mobility in older, obese adults in poor cardiovascular health. Arch Intern Med 2011;171:880‐886. [DOI] [PMC free article] [PubMed] [Google Scholar]
- 5. Rejeski WJ, Ambrosius WT, Burdette JH, Walkup MP, Marsh AP. Community weight loss to combat obesity and disability in at‐risk older adults. J Gerontol A Biol Sci Med Sci 2017;72:1547‐1553. [DOI] [PMC free article] [PubMed] [Google Scholar]
- 6. Look AHEAD Research Group . Eight‐year weight losses with an intensive lifestyle intervention: the Look AHEAD study. Obesity (Silver Spring) 2014;22:5‐13. [DOI] [PMC free article] [PubMed] [Google Scholar]
- 7. Anderson JW, Konz EC, Frederich RC, Wood CL. Long‐term weight‐loss maintenance: a meta‐analysis of US studies. Am J Clin Nutr 2001;74:579‐584. [DOI] [PubMed] [Google Scholar]
- 8. Mokhtari F, Rejeski WJ, Zhu Y, et al. Dynamic fMRI networks predict success in a behavioral weight loss program among older adults. Neuroimage 2018;173:421‐433. [DOI] [PMC free article] [PubMed] [Google Scholar]
- 9. Fanning JPM, Leng I, Lyles MF, Nicklas BJ, Rejeski WJ. Empowered with movement to prevent obesity and weight regain. Contemp Clin Trials 2018;72:35‐42. [DOI] [PubMed] [Google Scholar]
- 10. Lowe MR, Butryn ML. Hedonic hunger: a new dimension of appetite? Physiol Behav 2007;91:432‐439. [DOI] [PubMed] [Google Scholar]
- 11. Clark MM, Abrams DB, Niaura RS, Eaton CA, Rossi JS. Self‐efficacy in weight management. J Consult Clin Psychol 1991;59:739‐744. [DOI] [PubMed] [Google Scholar]
- 12. Lowe MR, Butryn ML, Didie ER, et al. The Power of Food Scale. A new measure of the psychological influence of the food environment. Appetite 2009;53:114‐118. [DOI] [PubMed] [Google Scholar]
- 13. Van Dillen LF, Papies EK, Hofmann W. Turning a blind eye to temptation: how cognitive load can facilitate self‐regulation. J Pers Soc Psychol 2013;104:427‐443. [DOI] [PubMed] [Google Scholar]
- 14. van Dillen LF, Andrade J. Derailing the streetcar named desire. Cognitive distractions reduce individual differences in cravings and unhealthy snacking in response to palatable food. Appetite 2016;96:102‐110. [DOI] [PubMed] [Google Scholar]
- 15. Rejeski WJ, Burdette JH, Burns M, et al. Power of food moderates food craving, perceived control, and brain networks following a short‐term post‐absorptive state in older adults. Appetite 2012;58:806‐813. [DOI] [PMC free article] [PubMed] [Google Scholar]
- 16. Bullins J, Laurienti PJ, Morgan AR, Norris J, Paolini BM, Rejeski WJ. Drive for consumption, craving, and connectivity in the visual cortex during the imagery of desired food. Front Aging Neurosci 2013;5:77. doi: 10.3389/fnagi.2013.00077 [DOI] [PMC free article] [PubMed] [Google Scholar]
- 17. Bas M, Donmez S. Self‐efficacy and restrained eating in relation to weight loss among overweight men and women in Turkey. Appetite 2009;52:209‐216. [DOI] [PubMed] [Google Scholar]
- 18. Linde JA, Rothman AJ, Baldwin AS, Jeffery RW. The impact of self‐efficacy on behavior change and weight change among overweight participants in a weight loss trial. Health Psychol 2006;25:282‐291. [DOI] [PubMed] [Google Scholar]
- 19. Martin PD, Dutton GR, Brantley PJ. Self‐efficacy as a predictor of weight change in African‐American women. Obes Res 2004;12:646‐51. [DOI] [PubMed] [Google Scholar]
- 20. Rejeski WJ, Mihalko SL, Ambrosius WT, Bearon LB, McClelland JW. Weight loss and self‐regulatory eating efficacy in older adults: the Cooperative Lifestyle Intervention Program. J Gerontol B Psychol Sci Soc Sci 2011;66:279‐286. [DOI] [PMC free article] [PubMed] [Google Scholar]
- 21. Chen S, Jia Y, Woltering S. Neural differences of inhibitory control between adolescents with obesity and their peers. Int J Obes (Lond) 2018;42:1753‐1761. [DOI] [PubMed] [Google Scholar]
- 22. Nasreddine ZS, Phillips NA, Bedirian V, et al. The Montreal Cognitive Assessment, MoCA: a brief screening tool for mild cognitive impairment. J Am Geriatr Soc 2005;53:695‐699. [DOI] [PubMed] [Google Scholar]
- 23. Espel‐Huynh HM, Muratore AF, Lowe MR. A narrative review of the construct of hedonic hunger and its measurement by the Power of Food Scale. Obes Sci Pract 2018;4:238‐249. [DOI] [PMC free article] [PubMed] [Google Scholar]
- 24. O'Neil PM, Theim KR, Boeka A, Johnson G, Miller‐Kovach K. Changes in weight control behaviors and hedonic hunger during a 12‐week commercial weight loss program. Eat Behav 2012;13:354‐360. [DOI] [PubMed] [Google Scholar]
- 25. Theim KR, Brown JD, Juarascio AS, Malcolm RR, O'Neil PM. Relations of hedonic hunger and behavioral change to weight loss among adults in a behavioral weight loss program utilizing meal‐replacement products. Behav Modif 2013;37:790‐805. [DOI] [PubMed] [Google Scholar]
- 26. Ames GE, Heckman MG, Grothe KB, Clark MM. Eating self‐efficacy: development of a short‐form WEL. Eat Behav 2012;13:375‐378. [DOI] [PubMed] [Google Scholar]
- 27. Ames GE, Heckman MG, Diehl NN, Grothe KB, Clark MM. Further statistical and clinical validity for the Weight Efficacy Lifestyle Questionnaire‐Short Form. Eat Behav 2015;18:115‐119. [DOI] [PubMed] [Google Scholar]
- 28. Shen X, Tokoglu F, Papademetris X, Constable RT. Groupwise whole‐brain parcellation from resting‐state fMRI data for network node identification. Neuroimage 2013;82:403‐415. [DOI] [PMC free article] [PubMed] [Google Scholar]
- 29. Bahrami M, Laurienti PJ, Simpson SL. A MATLAB toolbox for multivariate analysis of brain networks. Hum Brain Mapp 2019;40:175‐186. [DOI] [PMC free article] [PubMed] [Google Scholar]
- 30. Bahrami M, Laurienti PJ, Simpson SL. Analysis of brain subnetworks within the context of their whole‐brain networks. Hum Brain Mapp 2019;40:5123‐5141. [DOI] [PMC free article] [PubMed] [Google Scholar]
- 31. Bullmore E, Sporns O. Complex brain networks: graph theoretical analysis of structural and functional systems. Nat Rev Neurosci 2009;10:186‐198. [DOI] [PubMed] [Google Scholar]
- 32. Friedman EJ, Landsberg AS, Owen JP, Li YO, Mukherjee P. Stochastic geometric network models for groups of functional and structural connectomes. Neuroimage 2014;101:473‐484. [DOI] [PMC free article] [PubMed] [Google Scholar]
- 33. Kavanagh DJ, Andrade J, May J. Imaginary relish and exquisite torture: the elaborated intrusion theory of desire. Psychol Rev 2005;112:446‐467. [DOI] [PubMed] [Google Scholar]
- 34. Hopfinger JB, Buonocore MH, Mangun GR. The neural mechanisms of top‐down attentional control. Nat Neurosci 2000;3:284‐291. [DOI] [PubMed] [Google Scholar]
- 35. Dosenbach NU, Fair DA, Cohen AL, Schlaggar BL, Petersen SE. A dual‐networks architecture of top‐down control. Trends Cogn Sci 2008;12:99‐105. [DOI] [PMC free article] [PubMed] [Google Scholar]
- 36. Stice E, Figlewicz DP, Gosnell BA, Levine AS, Pratt WE. The contribution of brain reward circuits to the obesity epidemic. Neurosci Biobehav Rev 2013;37:2047‐2058. [DOI] [PMC free article] [PubMed] [Google Scholar]
- 37. Droutman V, Bechara A, Read SJ. Roles of the different sub‐regions of the insular cortex in various phases of the decision‐making process. Front Behav Neurosci 2015;9:309. doi: 10.3389/fnbeh.2015.00309 [DOI] [PMC free article] [PubMed] [Google Scholar]
- 38. Craig AD. Emotional moments across time: a possible neural basis for time perception in the anterior insula. Philos Trans R Soc Lond B Biol Sci 2009;364:1933‐1942. [DOI] [PMC free article] [PubMed] [Google Scholar]
- 39. Critchley HD. Psychophysiology of neural, cognitive and affective integration: fMRI and autonomic indicants. Int J Psychophysiol 2009;73:88‐94. [DOI] [PMC free article] [PubMed] [Google Scholar]
- 40. Volkow ND, Wang GJ, Fowler JS, Telang F. Overlapping neuronal circuits in addiction and obesity: evidence of systems pathology. Philos Trans R Soc Lond B Biol Sci 2008;363:3191‐3200. [DOI] [PMC free article] [PubMed] [Google Scholar]
- 41. Watts DJ, Strogatz SH. Collective dynamics of 'small‐world' networks. Nature 1998;393:440‐442. [DOI] [PubMed] [Google Scholar]
- 42. Flolo TN, Tell GS, Kolotkin RL, et al. Eating self‐efficacy as predictor of long‐term weight loss and obesity‐specific quality of life after sleeve gastrectomy: a prospective cohort study. Surg Obes Relat Dis 2019;15:161‐167. [DOI] [PubMed] [Google Scholar]
- 43. Rejeski WJ, Fanning J. Models and theories of health behavior and clinical interventions in aging: a contemporary, integrative approach. Clin Interv Aging 2019;14:1007‐1019. [DOI] [PMC free article] [PubMed] [Google Scholar]
- 44. Sheeran P, Gollwitzer PM, Bargh JA. Nonconscious processes and health. Health Psychol 2013;32:460‐473. [DOI] [PubMed] [Google Scholar]
Associated Data
This section collects any data citations, data availability statements, or supplementary materials included in this article.
Supplementary Materials
Supplementary Material