
Figure 2.
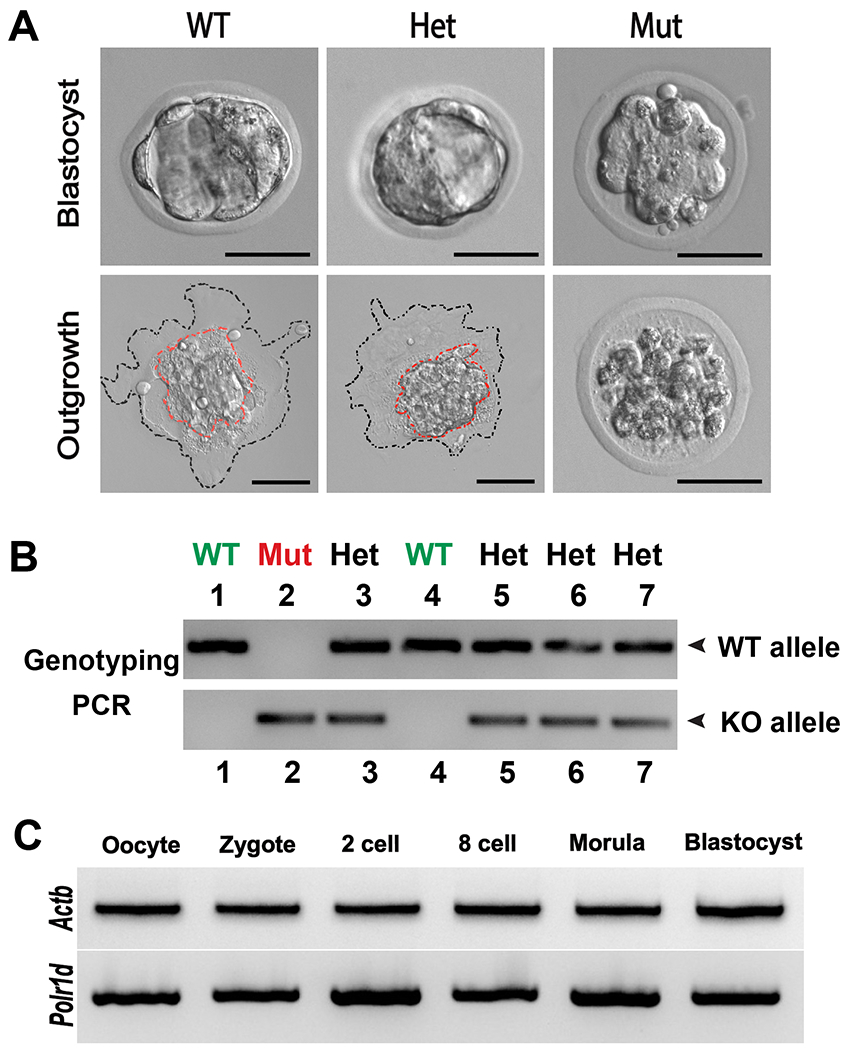
(A) E3.5 embryos from heterozygous intercrosses were imaged and subjected to outgrowth assays. While WT and Het embryos all reached blastocyst stage at E3.5, all Mut embryos displayed morula morphology. Outgrowths from WT and Het embryos displayed a distinctive ICM colony (red dashed line) surrounded by trophoblast cells (black dashed line). Mutants never formed blastocysts during the outgrowth culture, eventually dying. Scale bars, 50 μm. (B) Representative genotyping PCR of individual outgrowth. (C) RT-PCR showing Polr1d expression in WT pre-implantation embryos. Actb was used as control.