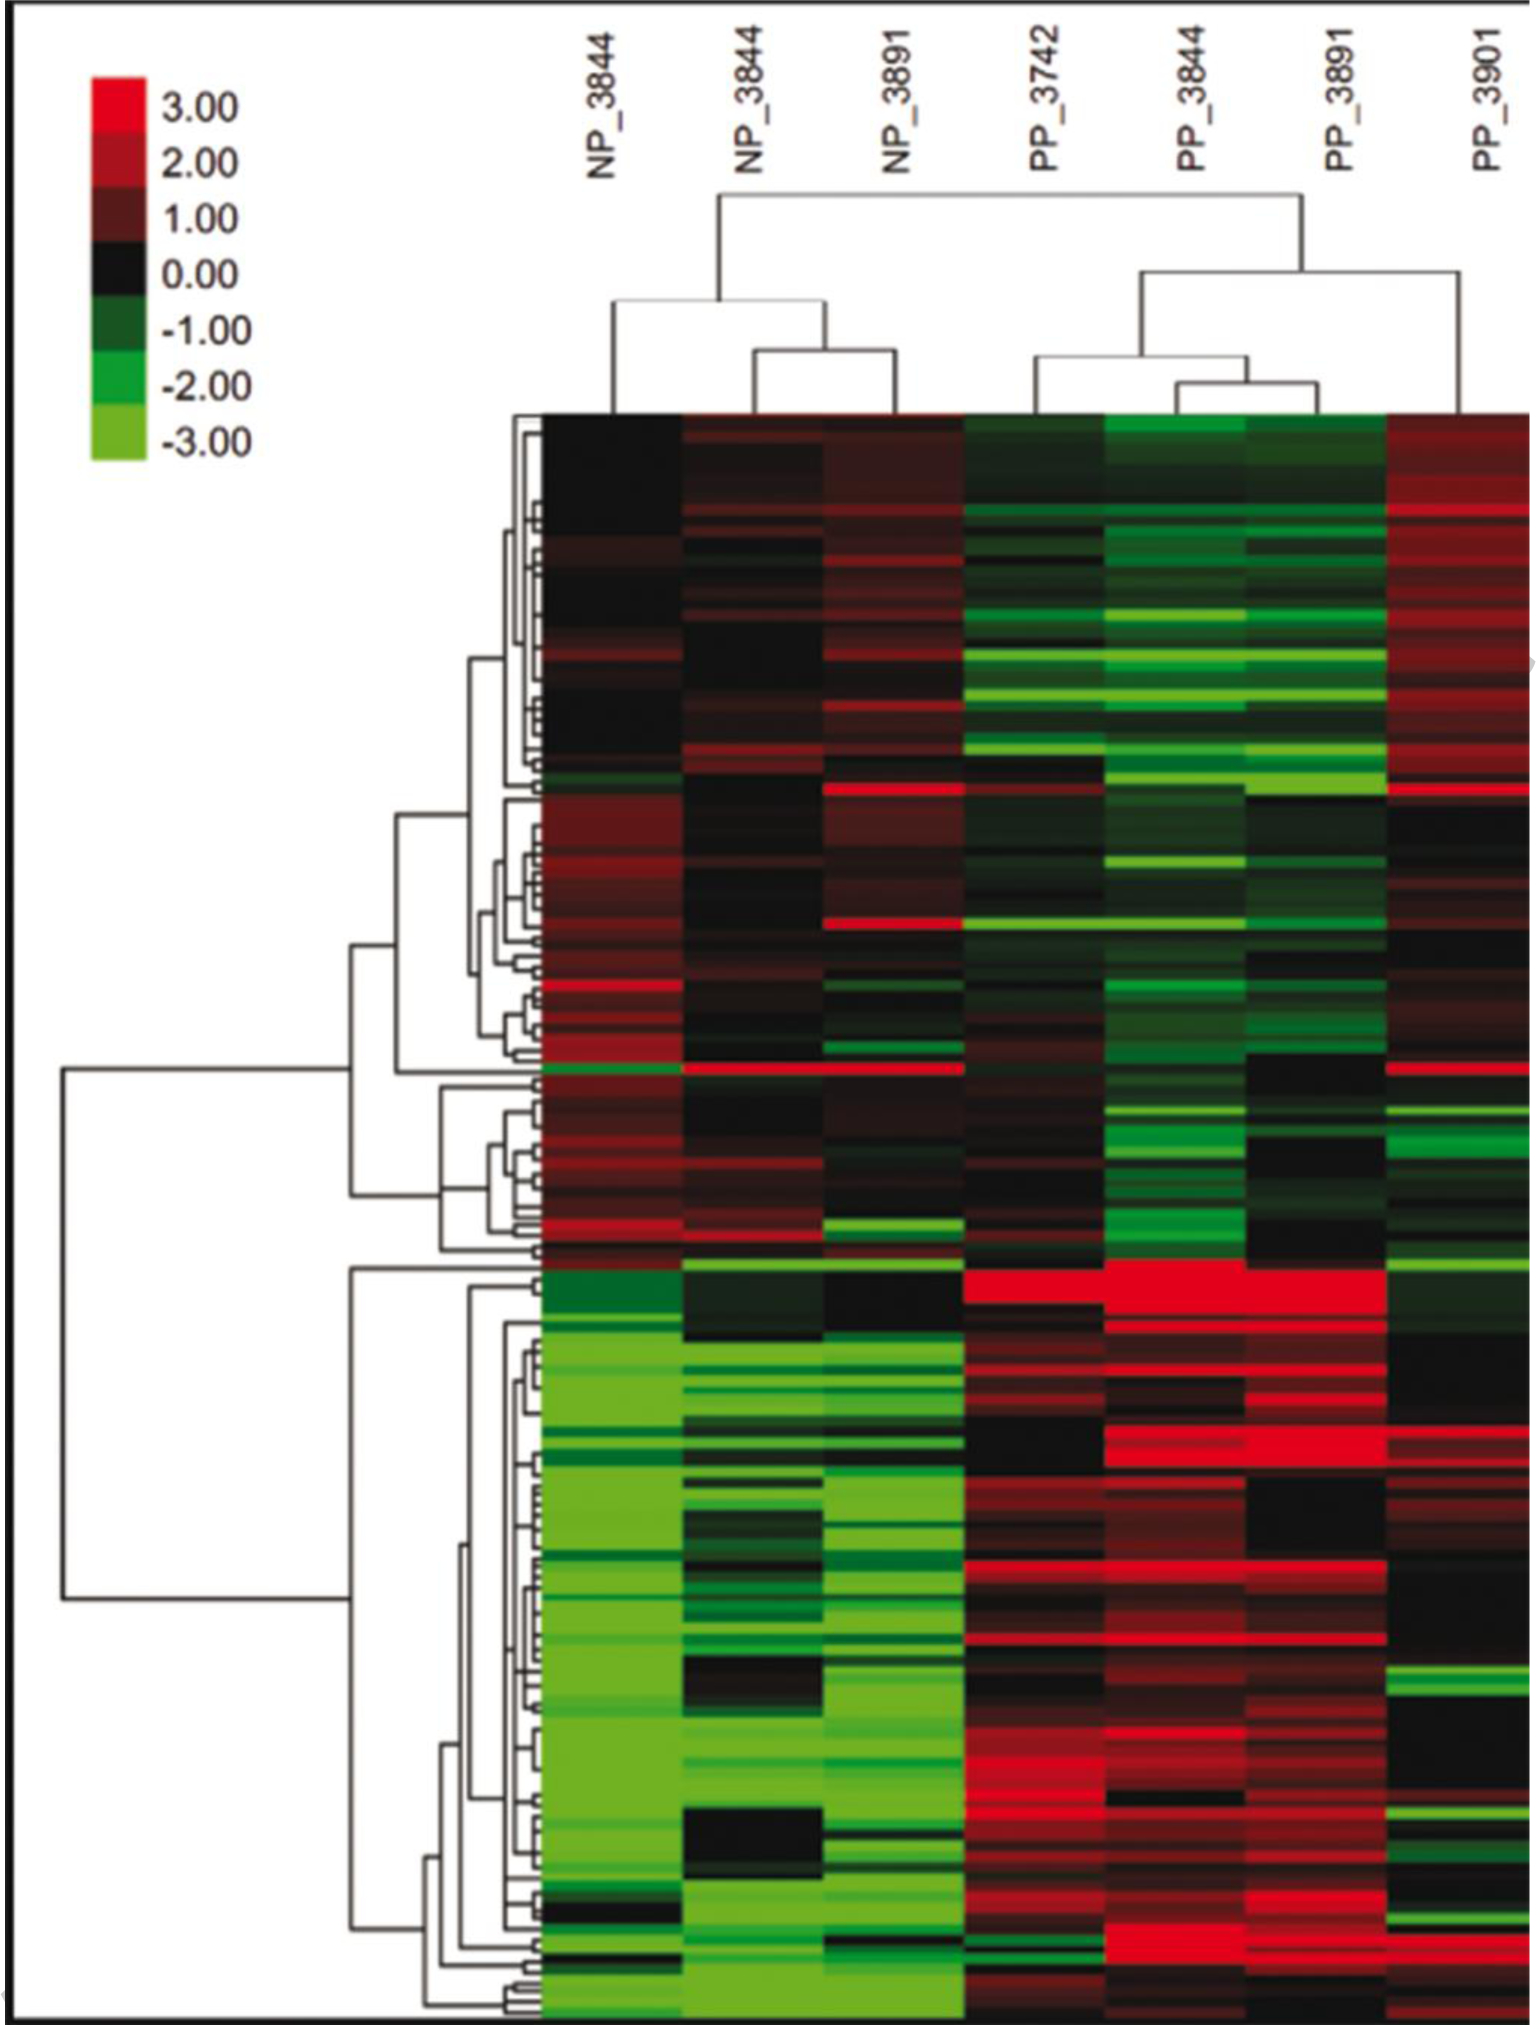
Fig. 2.

Heat map showing the expression pattern of genes that were differentially expressed between blastocysts that survived to day 30 and 60 (PP) compared to blastocysts that did not survive to day 30 (NP). Shown are the transformed and normalized expression values for each differentially-expressed gene (false discovery rate < 0.10) for each sample. The number following the PP and NP designation is the number of the donor from which the embryo was derived.
