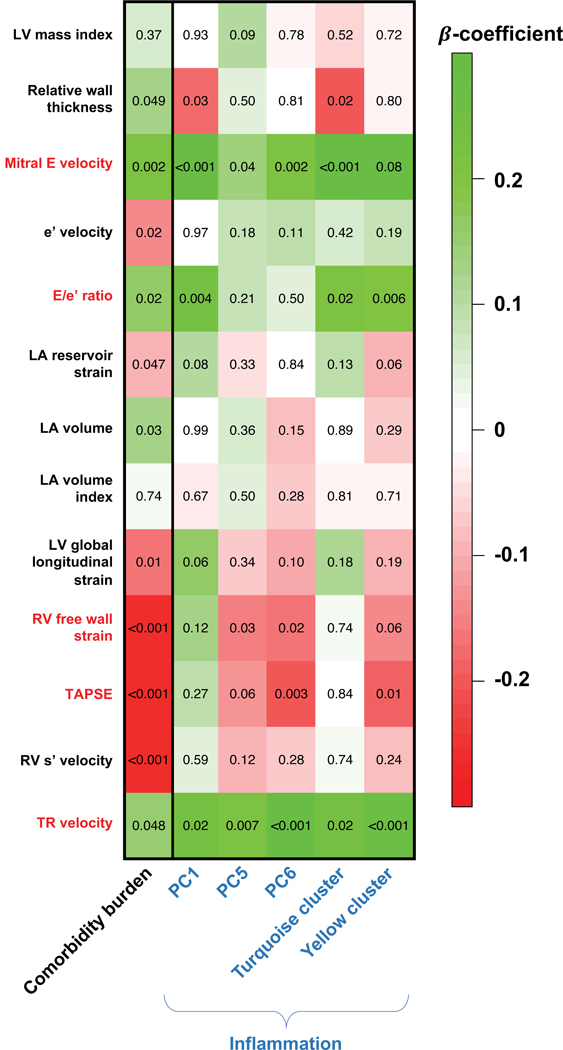
Figure 3. Heatmap of Associations of Comorbidity Burden and Inflammation with Indices of Cardiac Structure and Function in PROMIS-HFpEF.

The values in the cells represent p-values for the associations. The color and intensity of each cell depicts the standardized β-coefficients from linear regression models adjusted for age, gender, glomerular filtration rate, and study site (and atrial fibrillation, for LA indices and E/e’ ratio). Echocardiographic indices that were significantly associated with both comorbidity burden and inflammation (and thus fulfilling the assumptions for mediation analysis) are marked by red font. PC2, PC4, and the red cluster are not shown because of their lack of association with comorbidity burden; PC3 is not shown because all associations had P-values >0.20. Of the statistically significant associations (P<0.05), the yellow cluster was no longer associated with TAPSE after adjustment for inflammatory (autoimmune disease) and/or malignancy. Of the statistically significant associations (P<0.05), the following were no longer significant after correction for multiple testing (false discovery rate): PC1 and relative wall thickness; PC5 and mitral E velocity; PC5 and RV free wall strain; PC6 and RV free wall strain; turquoise cluster and relative wall thickness; turquoise cluster and E/e’ ratio; and turquoise cluster and TR velocity. LV = left ventricular; LA = left atrial; RV = right ventricular; TAPSE = tricuspid annular plane systolic excursion; TR = tricuspid regurgitation; PC = principal component.
