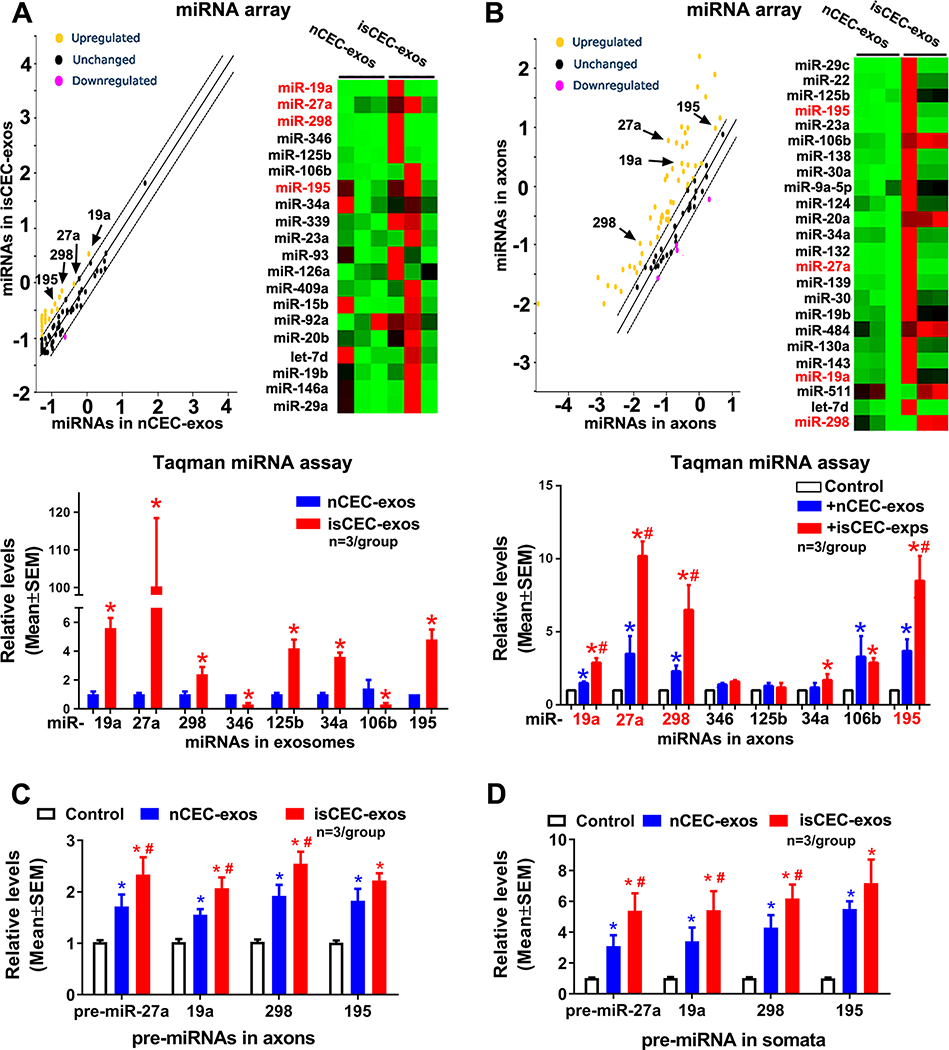
Figure 2. The effect of CEC-exos on levels of mature and precursor miRNAs and miRNA machinery proteins of cortical neurons.
Scatter plot and heatmap of miRNA PCR array data demonstrate the differential miRNAs in exosomes (A, upper), and the differential miRNAs in axons after axonal application of CEC-exos (B, upper). Quantitative RT-PCR data show the mature miRNAs in exosomes (A, lower), mature (B, lower) and precursor miRNAs (C) in axons and mature miRNAs in somata (D) after the axonal application of CEC-exos,. respectively. *, p<0.05 vs nCEC-exos in A, vs control in B-D; #, p<0.05 vs nCEC-exos in B-D. The heatmap images only listed partial miRNAs and please view all miRNAs measured in Supplemental Figure IV.

