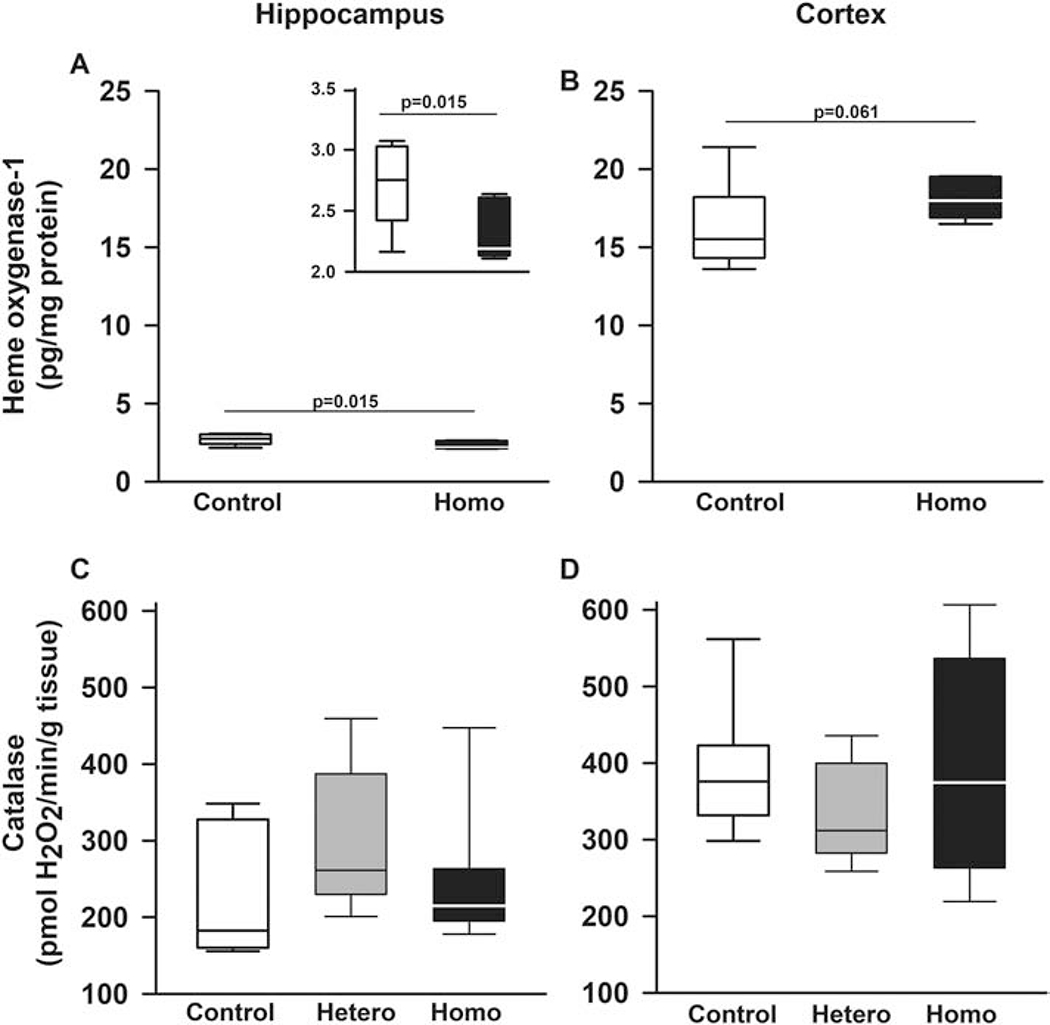
Figure 4. Sickle cell mice expression of antioxidant markers in the brain vary by region and marker.

Box plots of respective variables indicate the variable’s median and first and third quartiles and the whiskers the 5th and 95th percentiles. A and B. Heme oxygenase-1 levels varied according to genotype and brain region (p=0.031 for genotype by region interaction). Specifically, in hippocampus, homozygotes had lower (p=0.015, insert in A), whereas in cortex, a trend towards higher levels (p=0.061) of heme oxygenase-1 protein compared to control mice. Additionally, regardless of genotype, heme oxygenase-1 levels were higher in cortex than in hippocampus (p<0.0001, A and B). C. In hippocampi and D. cerebral cortex of Townes mice, mean catalase levels were similar comparing homozygotes, heterozygotes, and controls. N=4-8 mice per genotype.
