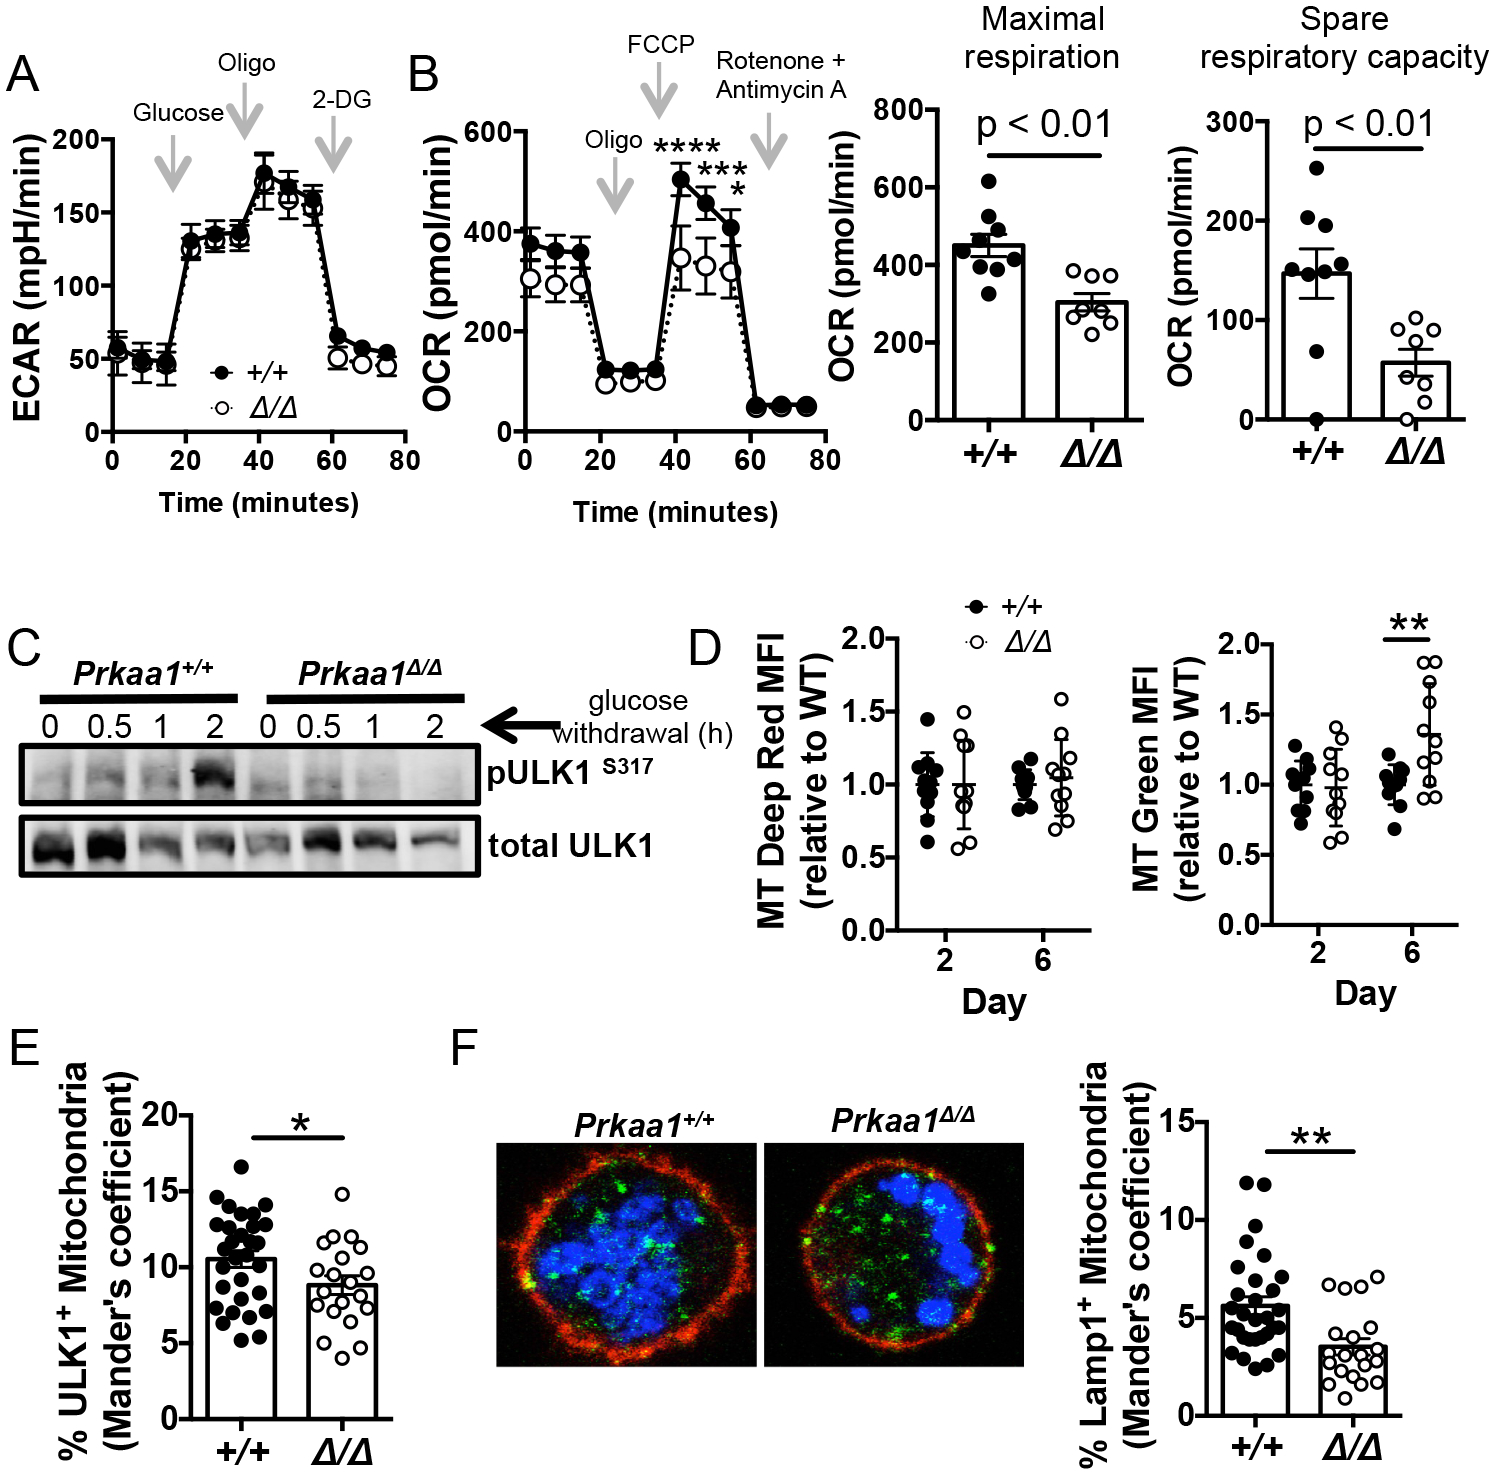
Figure 6. Loss of AMPKα1 in B cells leads to decreased mitochondrial function and defects in mitophagy.

(A) Glycolytic stress test after B cells from tamoxifen-treated Rosa26-ERT2Cre mice (Prkaa1 +/+ or Prkaa1 f/f ) were activated for 2 days with BAFF and LPS in the presence of 4-OHT. (B) Mitochondrial stress test after B cells from tamoxifen-treated Rosa26-ERT2Cre mice ± Prkaa1 f/f were activated for 2 days with BAFF and LPS in the presence of 4-OHT (left panel). Maximal respiration and spare respiratory capacity calculated by Seahorse report generator (right panels). Data represent three independent experiments with n = 9 vs. 8 mice. (C) Expression of pULK1S317, an AMPK target that initiates mitophagy, after glucose deprivation in day 2 LPS-activated cells. Data is representative of three independent experiments. (D) Relative MFI values for MitoTracker Deep Red (left panel) and MitoTracker Green (right panel) in the B220+ gate after activation with LPS, BAFF, IL-4, and IL-5 in the presence of 4-OHT. Data represent 4 independent experiments with 10 vs. 11 mice. (E) Quantification of ULK1 and MitoTracker Deep Red co-localization after 2 day activativation with LPS and BAFF. (F) Representative immunofluorescence of MitoTracker Deep Red and Lampl co-localization on day 2 LPS-activated cells. (Blue = MitoTracker Deep Red; green = Lamp1; red = B220). Quantification of Lamp1 and MitoTracker Deep Red co-localization (right panel). Data are representative of two independent experiments with n = 4 vs. 3 mice and 10 fields/mouse. P values determined by Mann-Whitney U non-parametric t-test or ANOVA where appropriate. * indicates p < 0.05, ** indicates p < 0.01, *** indicates p < 0.001, **** indicates p < 0.0001.
