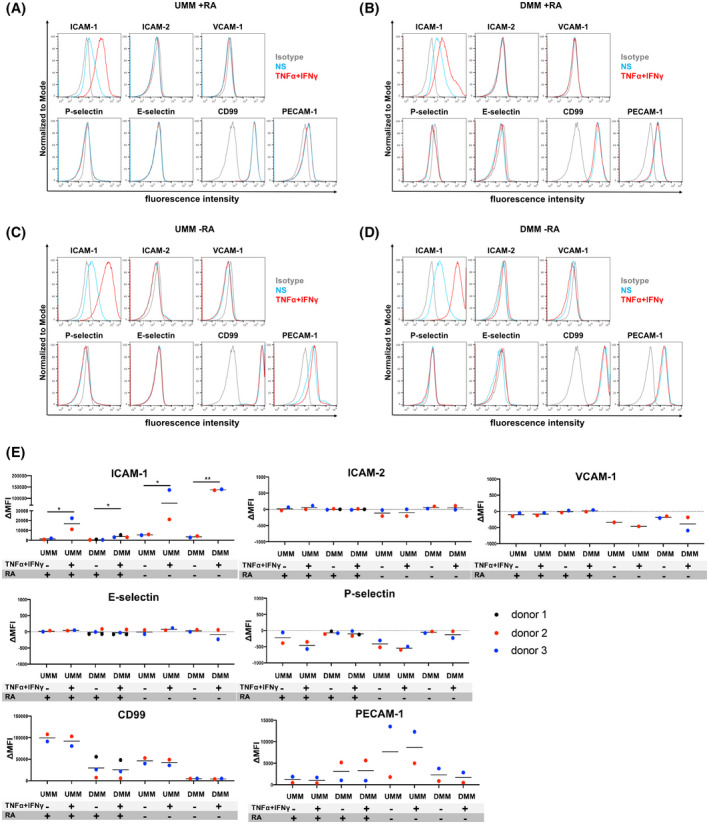
FIGURE 1.

Adhesion molecule phenotype of BMEC‐like cells differentiated by the unconditioned medium method (UMM) or the defined medium method (DMM). Cell surface staining of BMEC‐like cells differentiated by UMM (A, C) or DMM (B, D) in the presence or absence of RA for the adhesion molecules ICAM‐1, ICAM‐2, VCAM‐1, P‐selectin, E‐selectin, CD99, and PECAM‐1 was analyzed by flow cytometry. Isotype control, non‐stimulated (NS), and 16 h pro‐inflammatory cytokine‐stimulated condition (10 ng/mL TNF‐α + 200 IU/mL IFN‐γ) are represented in gray, blue, and red, respectively, in a histogram overlay. Representative data from donor 2 are shown. At least three independent differentiations were performed in each condition using two different hiPSC clones derived from two different donors (donor 2 and 3) for UMM‐differentiated BMEC‐like cells and three hiPSC clones from three donors (donor 1, 2, and 3) for DMM‐differentiated BMEC‐like cells with comparable data observed (eg, Figure S1). E, The Δ geometric mean (MFI staining–MFI isotype) of cell surface adhesion molecules of UMM‐ or DMM‐BMEC‐like cells were analyzed by flow cytometry. Displayed are the mean ∆MFI for each donor (donor 1: black, donor 2: red, and donor 3: blue). Mean ± S.D. from triplicate differentiations were used in a paired students t test to determine statistically significant changes upon stimulation (*P < .05, **P < .01).
