
FIGURE 2.
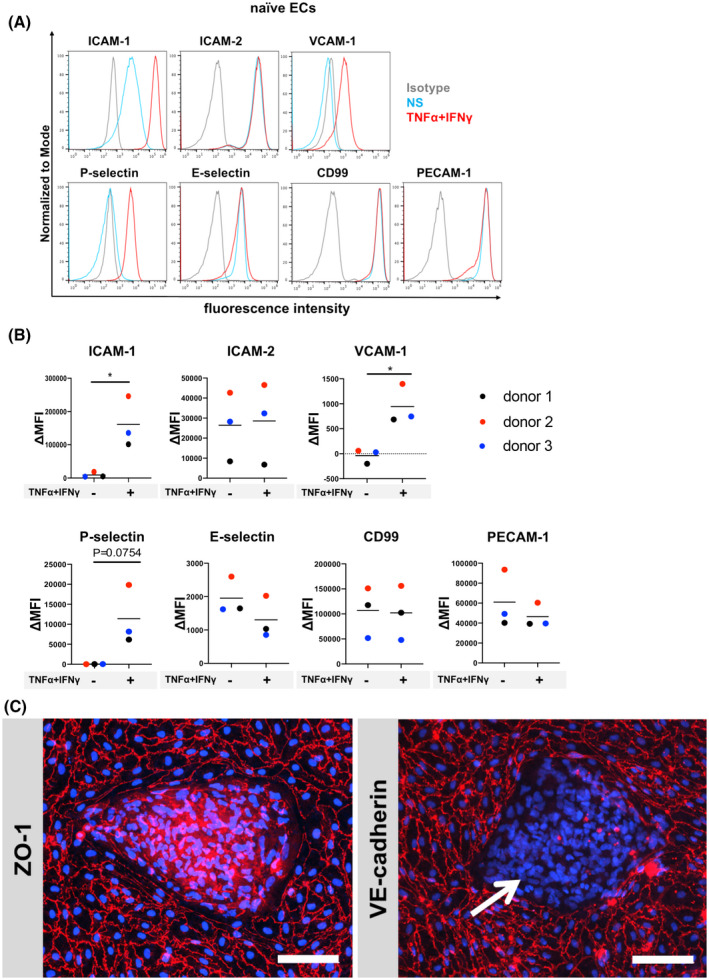
Adhesion molecule phenotype and morphology of hiPSC‐derived naïve ECs. A, Cell surface staining of hiPSC‐derived naïve ECs for the adhesion molecules ICAM‐1, ICAM‐2, VCAM‐1, P‐selectin, E‐selectin, CD99, and PECAM‐1 was analyzed by flow cytometry. Isotype control, non‐stimulated (NS), and 16 h pro‐inflammatory cytokine‐stimulated condition (1 ng/mL TNF‐α + 20 IU/mL IFN‐γ) are represented in gray, blue, and red, respectively, in a histogram overlay. Representative data from donor 2 are shown. Three independent differentiations were performed using three hiPSC clones from three donors (donor 1, 2, and 3) showing comparable data (eg, Figure S2). B, The Δ geometric mean (MFI staining–MFI isotype) of cell surface adhesion molecules of naïve ECs were analyzed by flow cytometry. Displayed are the mean ∆MFI for each donor (donor 1: black, donor 2: red, and donor 3: blue). Mean ± S.D. from triplicate differentiations were used in a paired students t test to determine statistically significant changes upon stimulation (*P < .05). C, Immunofluorescence staining of hiPSC‐derived naïve ECs grown on 0.4 µm pore Transwell filter inserts for ZO‐1 (red) or VE‐cadherin (red), and nuclei (DAPI, blue) is shown. Arrow depicts VE‐cadherin negative cells. Representative data from donor 2 are shown. Each staining is representative of at least three independent differentiations. Three hiPSC clones from three donors (donor 1, 2, and 3) were used in this assay and at least three independent differentiations were performed in each donor. Scale bars = 100 μm.