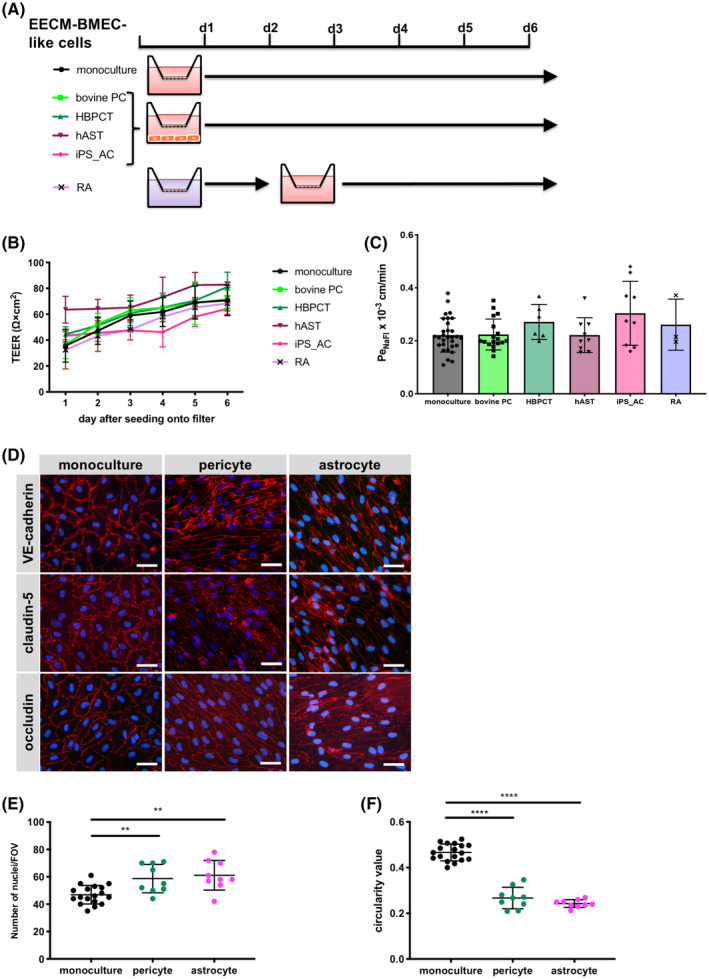
FIGURE 4.

Effect of co‐culture with astrocytes or pericytes on EECM‐BMEC‐like cell monolayers. A, Schematic representation of the protocols for EECM‐BMEC‐like cells co‐cultured with astrocytes or pericytes, or RA treatment is shown. B, TEER and (C) permeability of sodium fluorescein of EECM‐BMEC‐like cell monolayers are shown. EECM‐BMEC‐like cells (from passages 3‐5) were seeded onto 0.4 μm pore size Transwell filters and co‐cultured for 6 days with bovine pericytes ((bovine PC): light green), a human brain pericyte cell line ((HBPCT): green), a human astrocyte cell line ((hAST): dark red), hiPSC‐derived astrocytes ((iPS_AC): pink), or treated with RA for 2 days (purple). Monoculture was used as a control (black). B, Plotted data are mean TEER values ± SD. C, Bars show the mean permeability coefficients (Pe) ± SD. (B, C) Data are from at least three independent differentiations for co‐cultures each performed in triplicate using the same hiPSC clone. Representative data from donor 2 are shown. The following clones were tested for each condition: three hiPSC clones from two donors (donor 1 and 2) for bovine PC, two hiPSC clones from two donors (donor 1 and 2) for HBPCT, two hiPSC clones from two donors (donor 1 and 2) for hAST, and three hiPSC clones from two donors (donor 1, and 2) for iPS_AC and yielded comparable results (eg, Figure S4). D, Immunofluorescence staining of EECM‐BMEC‐like cells cultured on 0.4 μm pore size Transwell filters. EECM‐BMEC‐like cells were seeded onto Transwell filters and either co‐cultured with HBPCT (pericyte) or hiPSC‐derived astrocytes over 6 days. Monoculture was used as a control. Junctions were stained for VE‐cadherin (red), claudin‐5 (red), or occludin (red), and nuclei were stained with DAPI (blue). Representative data from donor 2 are shown. Each staining is representative of at least three independent differentiations performed on three distinct filters. Scale bars = 50 μm. E, The number of nuclei per pre‐defined field of view (FOV) of EECM‐BMEC‐like cells grown on 0.4 μm pore size Transwell filters is shown. ImageJ software was used to automatically count the nuclei. F, EC shape was analyzed using circularity values (4 × π × area/perimeter2) calculated from VE‐cadherin immunofluorescence images using ImageJ software. A value of 1.0 indicates a perfect circle. As the value approaches 0, it indicates an increasingly elongated shape of the cell. Each dot represents average circularity values of 10 randomly chosen cells/FOV. Data are shown as mean ± SD. Statistical analysis: one‐way ANOVA followed by Tukey’s multiple comparison test. (**P < .01, ****P < .0001).
