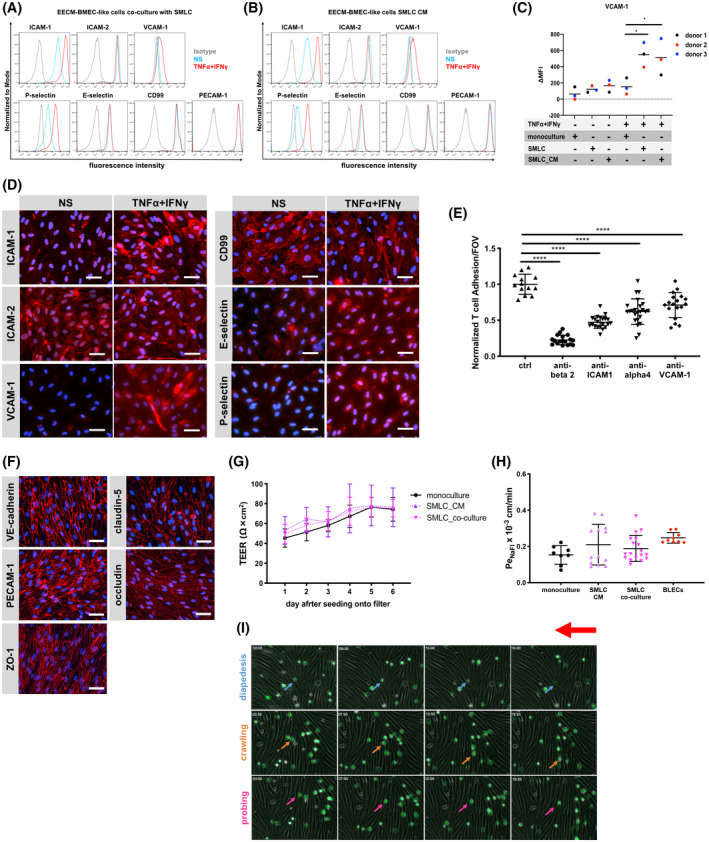
FIGURE 6.

Human iPSC‐derived smooth muscle‐like cells (SMLCs) or conditioned medium enhances VCAM‐1 expression on EECM‐BMEC‐like cells without impairing barrier properties. Cell surface staining of EECM‐BMEC‐like cells co‐cultured with hiPSC‐derived SMLCs (A) or conditioned medium from hiPSC‐derived SMLC (B) for the adhesion molecules ICAM‐1, ICAM‐2, VCAM‐1, P‐selectin, E‐selectin, CD99, and PECAM‐1 was analyzed by flow cytometry. Isotype control, non‐stimulated (NS), and 16 h pro‐inflammatory cytokine‐stimulated condition (1 ng/mL TNF‐α + 20 IU/mL IFN‐γ) are represented in gray, blue, and red lines, respectively, in a histogram overlay. Representative data from donor 3 are shown. Three hiPSC clones from three donors (donor 1, 2, and 3) were used in this assay (eg, Figure S8). C, The Δ geometric mean (MFI staining–MFI isotype) of cell surface VCAM‐1 of EECM‐BMEC‐like cells were analyzed by flow cytometry. Monocultured EECM‐BMEC‐like cells, EECM‐BMEC‐like cells co‐cultured with hiPSC‐derived SMLCs, or cultivated with conditioned medium from hiPSC‐derived SMLC are shown. Each symbol (donor 1: black, donor 2: red, and donor 3: blue) shows the mean of at least three independent differentiations (co‐culture condition, donor 1: n=3, donor 2: n= 4, and donor 3: n= 7). Statistical analysis: one‐way ANOVA followed by Tukey’s multiple comparison test. (*P < .05). D, Immunofluorescence staining of EECM‐BMEC‐like cells derived from donor 3 grown to confluency in chamber slides using conditioned medium from hiPSC‐derived SMLCs for ICAM‐1 (red), ICAM‐2 (red), VCAM‐1 (red), P‐selectin (red), E‐selectin (red), or CD99 (red) are shown. Nuclei were stained with DAPI (blue). NS and 16 h pro‐inflammatory cytokine‐stimulated condition (0.1 ng/mL TNF‐α + 2 IU/mL IFN‐γ) are shown. Each staining is representative of at least three independent differentiations performed on three distinct chamber slides. Scale bars = 50 μm. E, The number of Th1* cells adherent to 16 h pro‐inflammatory cytokine‐stimulated (0.1 ng/mL TNF‐α + 2 IU/mL IFN‐γ) EECM‐BMEC‐like cell monolayers derived from donor 2 cultured in the presence of SMLC‐derived conditioned medium, normalized to control condition was measured after 30 minutes of adhesion under static conditions. Adherent cells/FOV is the mean number of cells from two fields per well automatically counted using ImageJ. EECM‐BMEC‐like cells were preincubated with either anti‐human ICAM‐1 (10 μg/mL, clone R6.5), anti‐human VCAM‐1 (10 μg/mL, polyclonal), or isotype control for 30 minutes at 37°C. Th1* cells were pretreated with either anti‐human beta2 integrin (10 μg/mL, clone TS1/18), humanized anti‐human α4 integrin IgG4 (10 μg/mL, Natalizumab), or isotype controls for 30 minutes at 37°C. Data are shown as the mean ± SD of three individual differentiations each performed in at least triplicates. Statistical analysis: one‐way ANOVA followed by Tukey’s multiple comparison test (****P < .0001). F, Immunofluorescence staining on EECM‐BMEC‐like cells grown on 0.4 μm pore size Transwell filters co‐cultured with SMLCs. Junctions were stained for VE‐cadherin (red), PECAM‐1 (red), ZO‐1 (red), claudin‐5 (red), or occludin (red), and nuclei were stained with DAPI (blue). Representative data from donor 2 is shown. Each staining is representative of at least three independent differentiations performed on three distinct filters. Five hiPSC clones from three donors (donor 1, 2, and 3) were used in this assay. Scale bars = 50 μm. G, TEER and (H) permeability of sodium fluorescein of EECM‐BMEC‐like cell monolayers derived from donor 2 co‐cultured with SMLCs or cultured in the presence of SMLC conditioned medium. EECM‐BMEC‐like cells were grown on 0.4 μm pore size Transwell filters in the presence of either SMLCs (pink) or conditioned medium from SMLCs in the lower chamber (abluminal side) (purple) for 6 days. G, Plotted data are mean TEER values ± SD. H, Bars show the mean permeability coefficients (Pe) ± SD. (G, H) Data are representative of at least three independent differentiations with three filters per conditions. Three hiPSC clones from three donors (donor 1, 2, and 3) were used in this assay yielding comparable results. Human CD34+ cord blood stem cell‐derived brain‐like endothelial cells (BLECs, red) were used for a comparison to a previously developed human in vitro BBB model. I, In vitro live cell imaging of the Th1* cell/EECM‐BMEC‐like cells interactions under flow. A temporal snapshot illustrating that the different Th1* cell‐EECM‐BMEC‐like cells interactions have been made with several frames taken from a video recorded with a 10× magnification. EECM‐BMEC‐like cells from donor 2 were cultured in cloning rings placed on collagen IV (10 μg/mL)‐coated Ibidi μ‐dishes at a density of 75,000/cm2. EECM‐BMEC‐like cells were stimulated with 0.1 ng/mL recombinant human TNF‐α + 2 IU/mL IFN‐γ for 16 h at 37°C (5% CO2) diluted in conditioned medium from SMLC. Fluorescencently labeled Th1* cells were allowed to accumulate on the EECM‐BMEC‐like cell monolayer at a low flow rate of 0.1 dyne/cm2 for 4 min from the first frame after the first Th1* cells appear in the field of view (accumulation phase until 3 min 55 s). After the accumulation phase of precisely 3 min 55 sec, the flow rate was set to 1.5 dyne/cm2 for 16 min (shear phase). Each row of images shows a different behavior (diapedesis (blue), crawling (orange), probing (pink)) of the Th1* cells with the EECM‐BMEC‐like cells. The red arrow shows the direction of flow and the time is displayed on the top left of each image (min:sec format). Time‐lapse video showing Th1* cell interaction on EECM‐BMEC‐like cells is provided as Video S1. During the recording, 1 picture is acquired every 5 second then the video is exported with a framerate of 30 images/second. The video is repeated four times, the first run shows the full‐scale video, the second run is a zoom in of area highlighting T cells diapedesis (blue circles) and the third run is a zoom in crawling (orange circle) and diapedesis (blue circle), and the last run is a zoom in of one area highlighting crawling (orange circles) and probing (pink circle) events. The red arrow shows the direction of flow and the time is displayed on the top left of the video (min:sec format).
