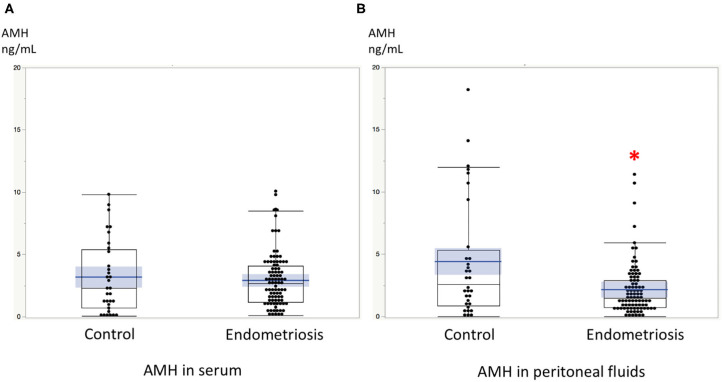
Figure 3.
(A) The comparison of serum AMH levels between women with endometriosis and control women without disease. (B) The comparison of AMH levels in peritoneal fluids between women with endometriosis and control women without disease. *AMH levels in PF were significantly lower in women with endometriosis compared to those of control women without disease. Boxes represent the distance (interquartile range) between the first (25%) and third (75%) quartiles, and horizontal lines in the boxes represent median values. Blue horizontal line represents mean value and blue-colored square box represents 95% confidence interval. Each dot represents the exact value of individual cases.

