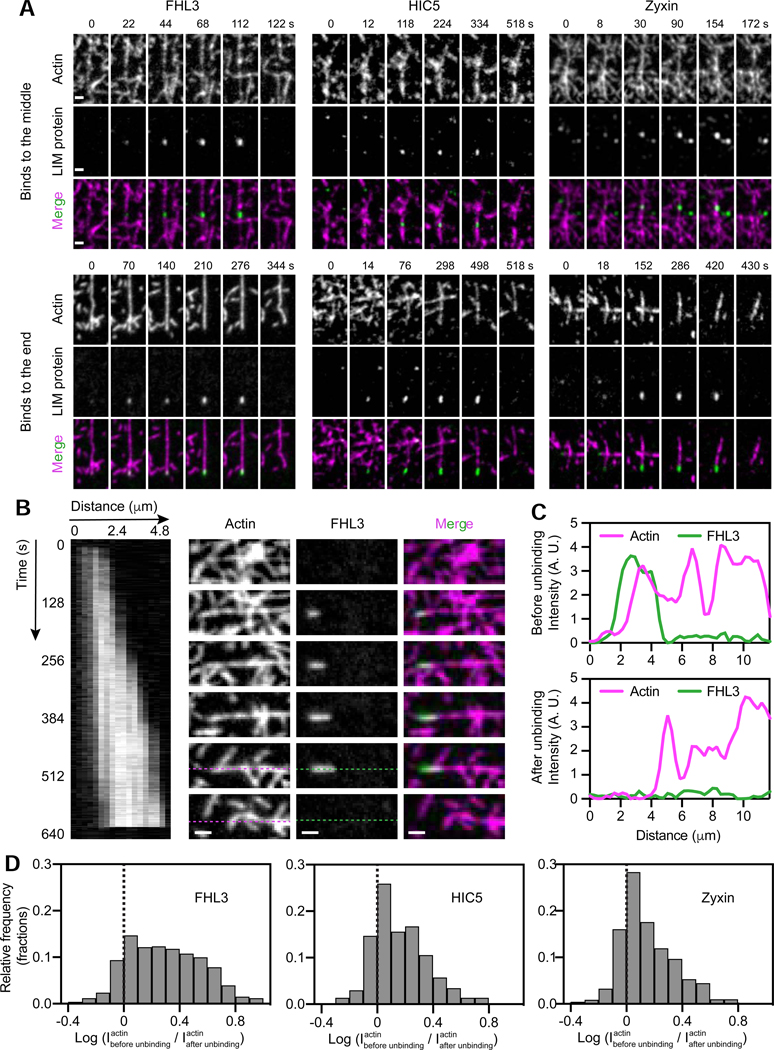
Figure 6. LIM proteins bind along filament regions featuring a pre-break state of F-actin.
(A) Montages of indicated constructs forming patches in the middle (top) and at the terminal segments (bottom) of actin filaments in the presence of force generation. Scale bars, 2 μm. (B) Kymograph (left, FHL3 channel) and montage (right) of an FHL3 patch. Snapshots correspond to the time points indicated along the kymograph. Scale bar, 2 μm. (C) Intensity line scan along dotted lines shown in B before (top) and after (bottom) FHL3 disappearance. (D) Log ratio histograms of actin intensity at detected patches of the indicated constructs before versus immediately after LIM-protein disappearance. Dashed line denotes equal intensity. See also Figures S5 and S6.

