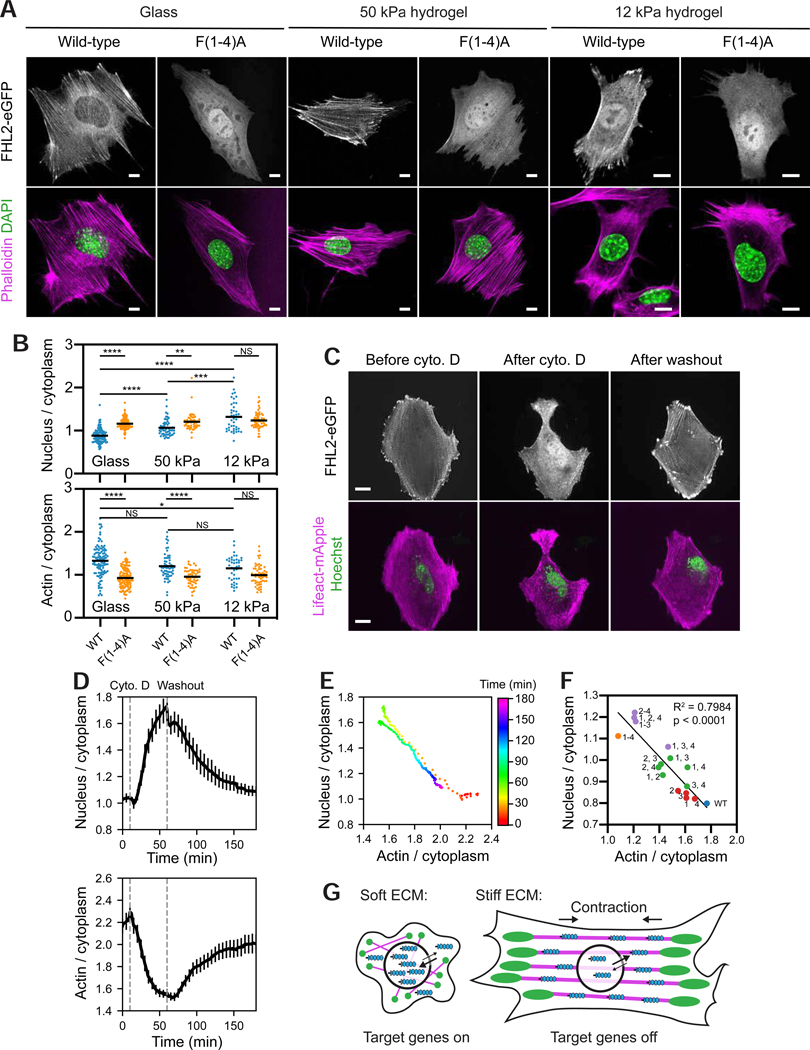
Figure 7. Tensed F-actin retains FHL2 in the cytoplasm.
(A) Confocal slices of MEFs expressing indicated FHL2-eGFP constructs plated on substrates of varying stiffness and stained with phalloidin (magenta) to label F-actin and DAPI (green) to label nuclei. Scale bars, 10 μm. (B) Quantification of stiffness-dependent nuclear (top) and actin (bottom) enrichment of wild-type and FHL2 F(1–4)A. N = 2 biological replicates; bars represent means. Games-Howell’s multiple comparison test after Welch’s ANOVA: NS, p > 0.05; * p < 0.05; ** p < 0.01; *** p < 0.001; **** p < 0.0001. (C) Spinning-disk confocal snapshots of FHL2-eGFP localization in a MEF before (left) and after (middle) cytochalasin D (cyto D) treatment, and after washout (right). Scale bars, 20 μm. (D) Average nuclear (top) and actin (bottom) enrichments (n = 19 cells; N = 13 biological replicates) over time, aligned at the timepoint of cyto D addition (10 min). Error bar represents SEM. Dash lines indicate cyto D addition and washout. (E) Replotting of average nuclear enrichment versus average actin enrichment as a time color-coded scatterplot. (F) Scatter plot of average nuclear enrichment versus average actin enrichment of FHL2 with zero (blue), one (red), two (green), three (purple), and four (orange) phenylalanine mutations in the indicated LIM domains. Data were extracted from experiments displayed in Figure 4E. Trend line and parameters from a linear fit are displayed. (G) Model of rigidity-dependent nuclear localization of FHL2. Magenta, SFs. Green, FAs. Blue, FHL2. See also Figure S7.

