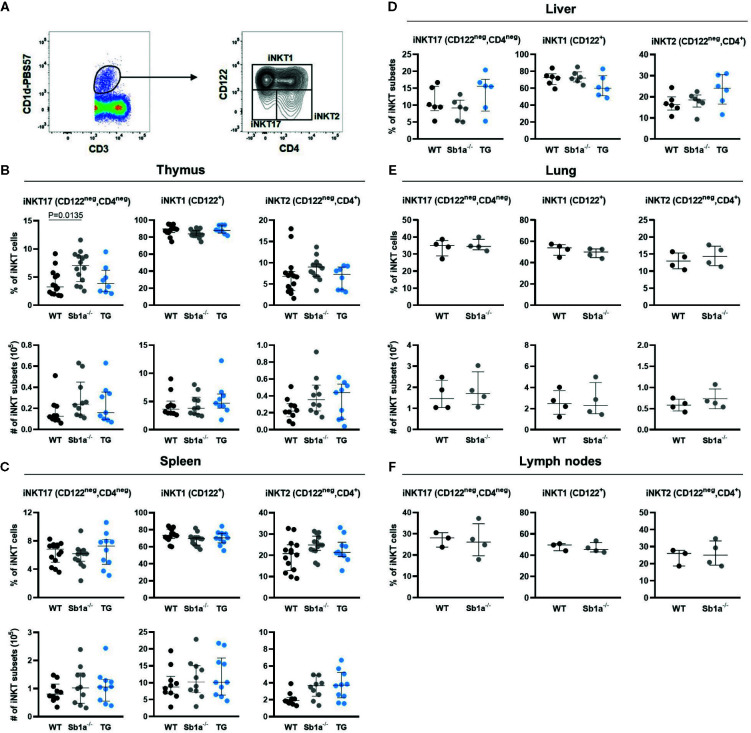
Figure 2.
Surface marker expression analysis of iNKT subsets shows increased thymic iNKT17 cells in Sb1a−/− mice. (A) Representative flow cytometry plots of iNKT cell subsets based on CD122 and CD4 expression on CD1d-tet+ iNKT cells. Percentages and numbers of iNKT17, iNKT1, and iNKT2 in thymus (B), spleen (C), liver (D), lung (E), and lymph nodes (F) of mice of the indicated genotypes. Data were from groups of 6-25 week-old mice matched for sex and age between genotypes. Data are from at least four independent experiments. Values for individual mice are shown with median and interquartile range.

