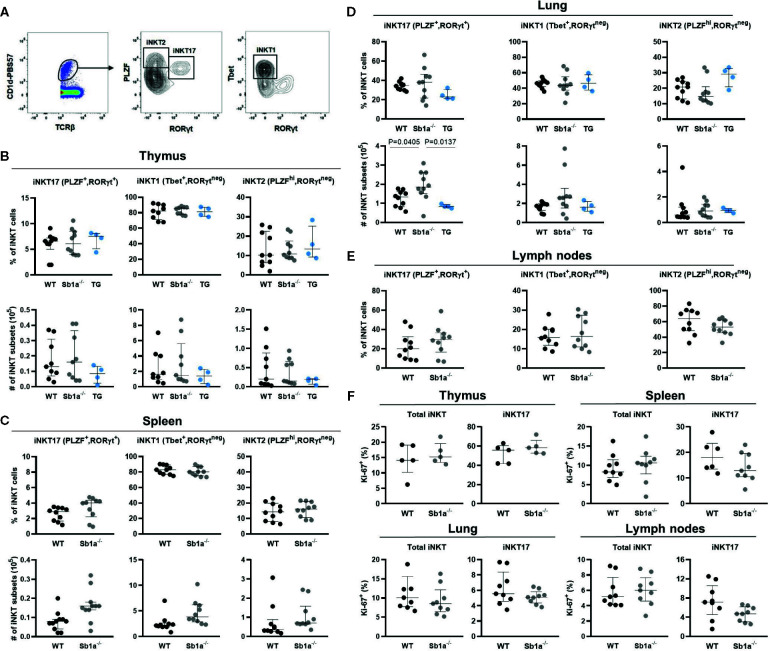
Figure 3.
Transcription factor expression analysis of iNKT subsets indicates normal thymic iNKT17 cells in Sb1a−/− mice. (A) Representative flow cytometry plots of iNKT cell subsets based on PLZF, T-bet and RORγt expression on CD1d-tet+ iNKT cells. (B) Percentages and numbers of iNKT17, 1 and 2 in thymus (B), spleen (C), lung (D), and lymph nodes (E). Percentages of total iNKT and iNKT17 Ki-67+ cells in indicated organs. (F) Data were from groups of 6- to 8-week-old mice matched for sex and age between genotypes. Data are from at least four independent experiments. Values for individual mice are shown with median and interquartile range.

