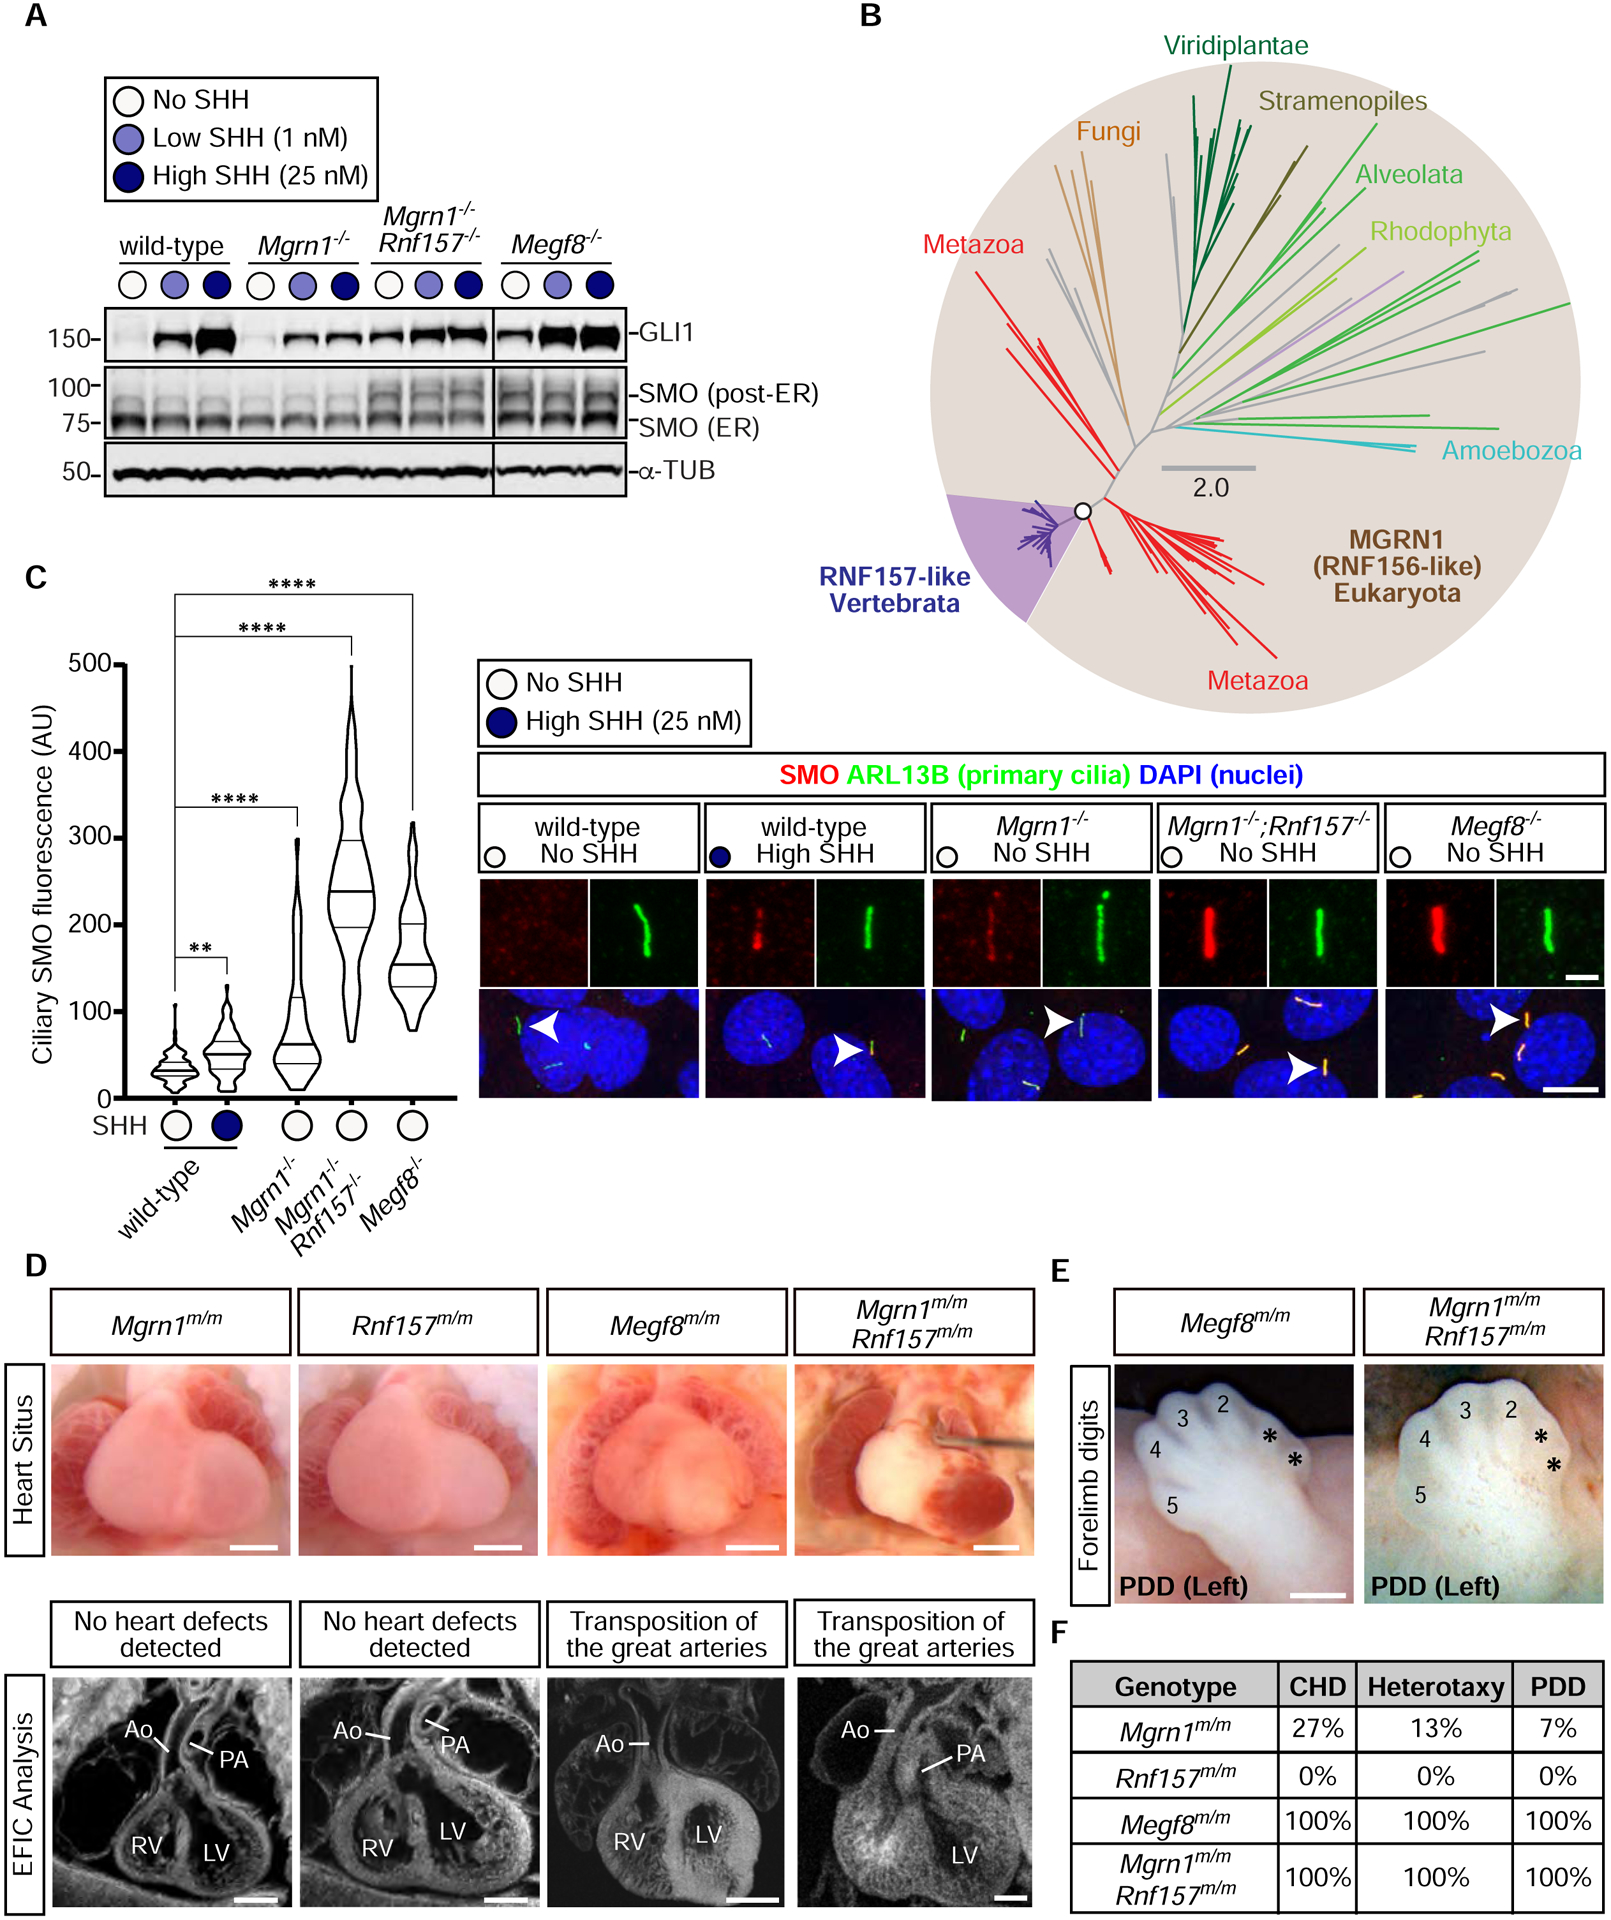
Figure 2: RNF157 partially compensates for the loss of MGRN1.

(A) Immunoblots showing GLI1 as a measure of Hh signaling strength and SMO abundance in the indicated NIH/3T3 cell lines treated with various concentrations of SHH. α-Tubulin (α-TUB) is a loading control. Two populations of SMO, localized in the ER or in post-ER compartments, are marked. An analysis of additional clonal cell lines is shown in Fig. S3C.
(B) Unrooted maximum-likelihood tree topology showing the evolutionary relationship between MGRN1 and RNF157, with the vertebrate-specific RNF157 lineage highlighted in purple. The open circle denotes 100% confidence support (1000 replicates) and the scale bar indicates phylogenetic distance. The full Newick tree file is provided in Supplemental File 1.
(C) Violin plots (left) with horizontal lines denoting the median and interquartile range and corresponding representative confocal fluorescence microscopy images (right) of SMO (red) at primary cilia (green, marked by ARL13B) in NIH/3T3 cells with the indicated genotypes (n~70 cilia/condition). Arrowheads identify individual cilia captured in the zoomed images above each panel. Statistical significance was determined by the Kruskal-Wallis test; **p-value ≤ 0.01 and ****p-value ≤ 0.0001. Scale bars, 10 μm in merged panels and 2 μm in zoomed displays. See Fig. S3D for an analysis of additional clonal cell lines.
(D) Necropsy (top row) and episcopic confocal microscopy (ECM, bottom row) images of embryonic hearts from e13.5–14.5 embryos of the indicated genotypes. Scale bars, 200 μm.
(E) Forelimbs of embryos show preaxial digit duplication (PDD). Asterisks (*) mark the duplicated digits. Scale bar, 200 μm.
(F) Table summarizes the frequency of CHDs, heterotaxy, and PDD in Mgrn1m/m (n=15), Rnf157m/m (n=6), Megf8m/m (n=12), and Mgrn1m/m;Rnf157m/m (n=3) embryos. A detailed list of phenotypes observed in each embryo can be found in Table S1. See also Figure S3, Table S1, and File S1.
