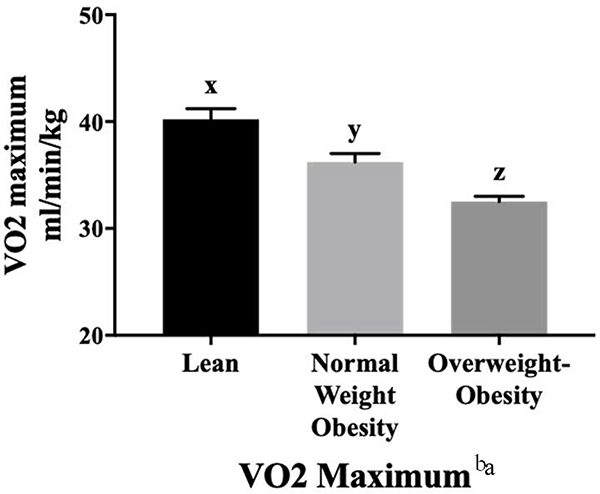
Figure 2.
Average (Mean ± SE, adjusting for age, race, sex, and education) VO2 maximum values for participants classified as lean (n=91), having normal weight obesity (n=154), or as having overweight-obesity (n=383) participating in the Emory-Georgia Tech Predictive Health Initiative cohort classified according to body composition subtype. VO2 maximum values in ml/min/kg (adjusted mean ± SE) were 40.2 ± 1.0 for the lean, 36.2 ± 0.8 for the NWO, and 32.5 ± 0.5 for the overweight-obesity groups.
a There was significant effect modification between age and VO2 maximum. Among individuals with NWO, there was a significant decline in VO2 maximum with aging.
xyz Results of Tukey’s post hoc analyses are denoted by superscript letters x, y, and z and indicate significant differences between groups for each row. Values that are not connected by the same letter are significantly different at P < 0.05.

