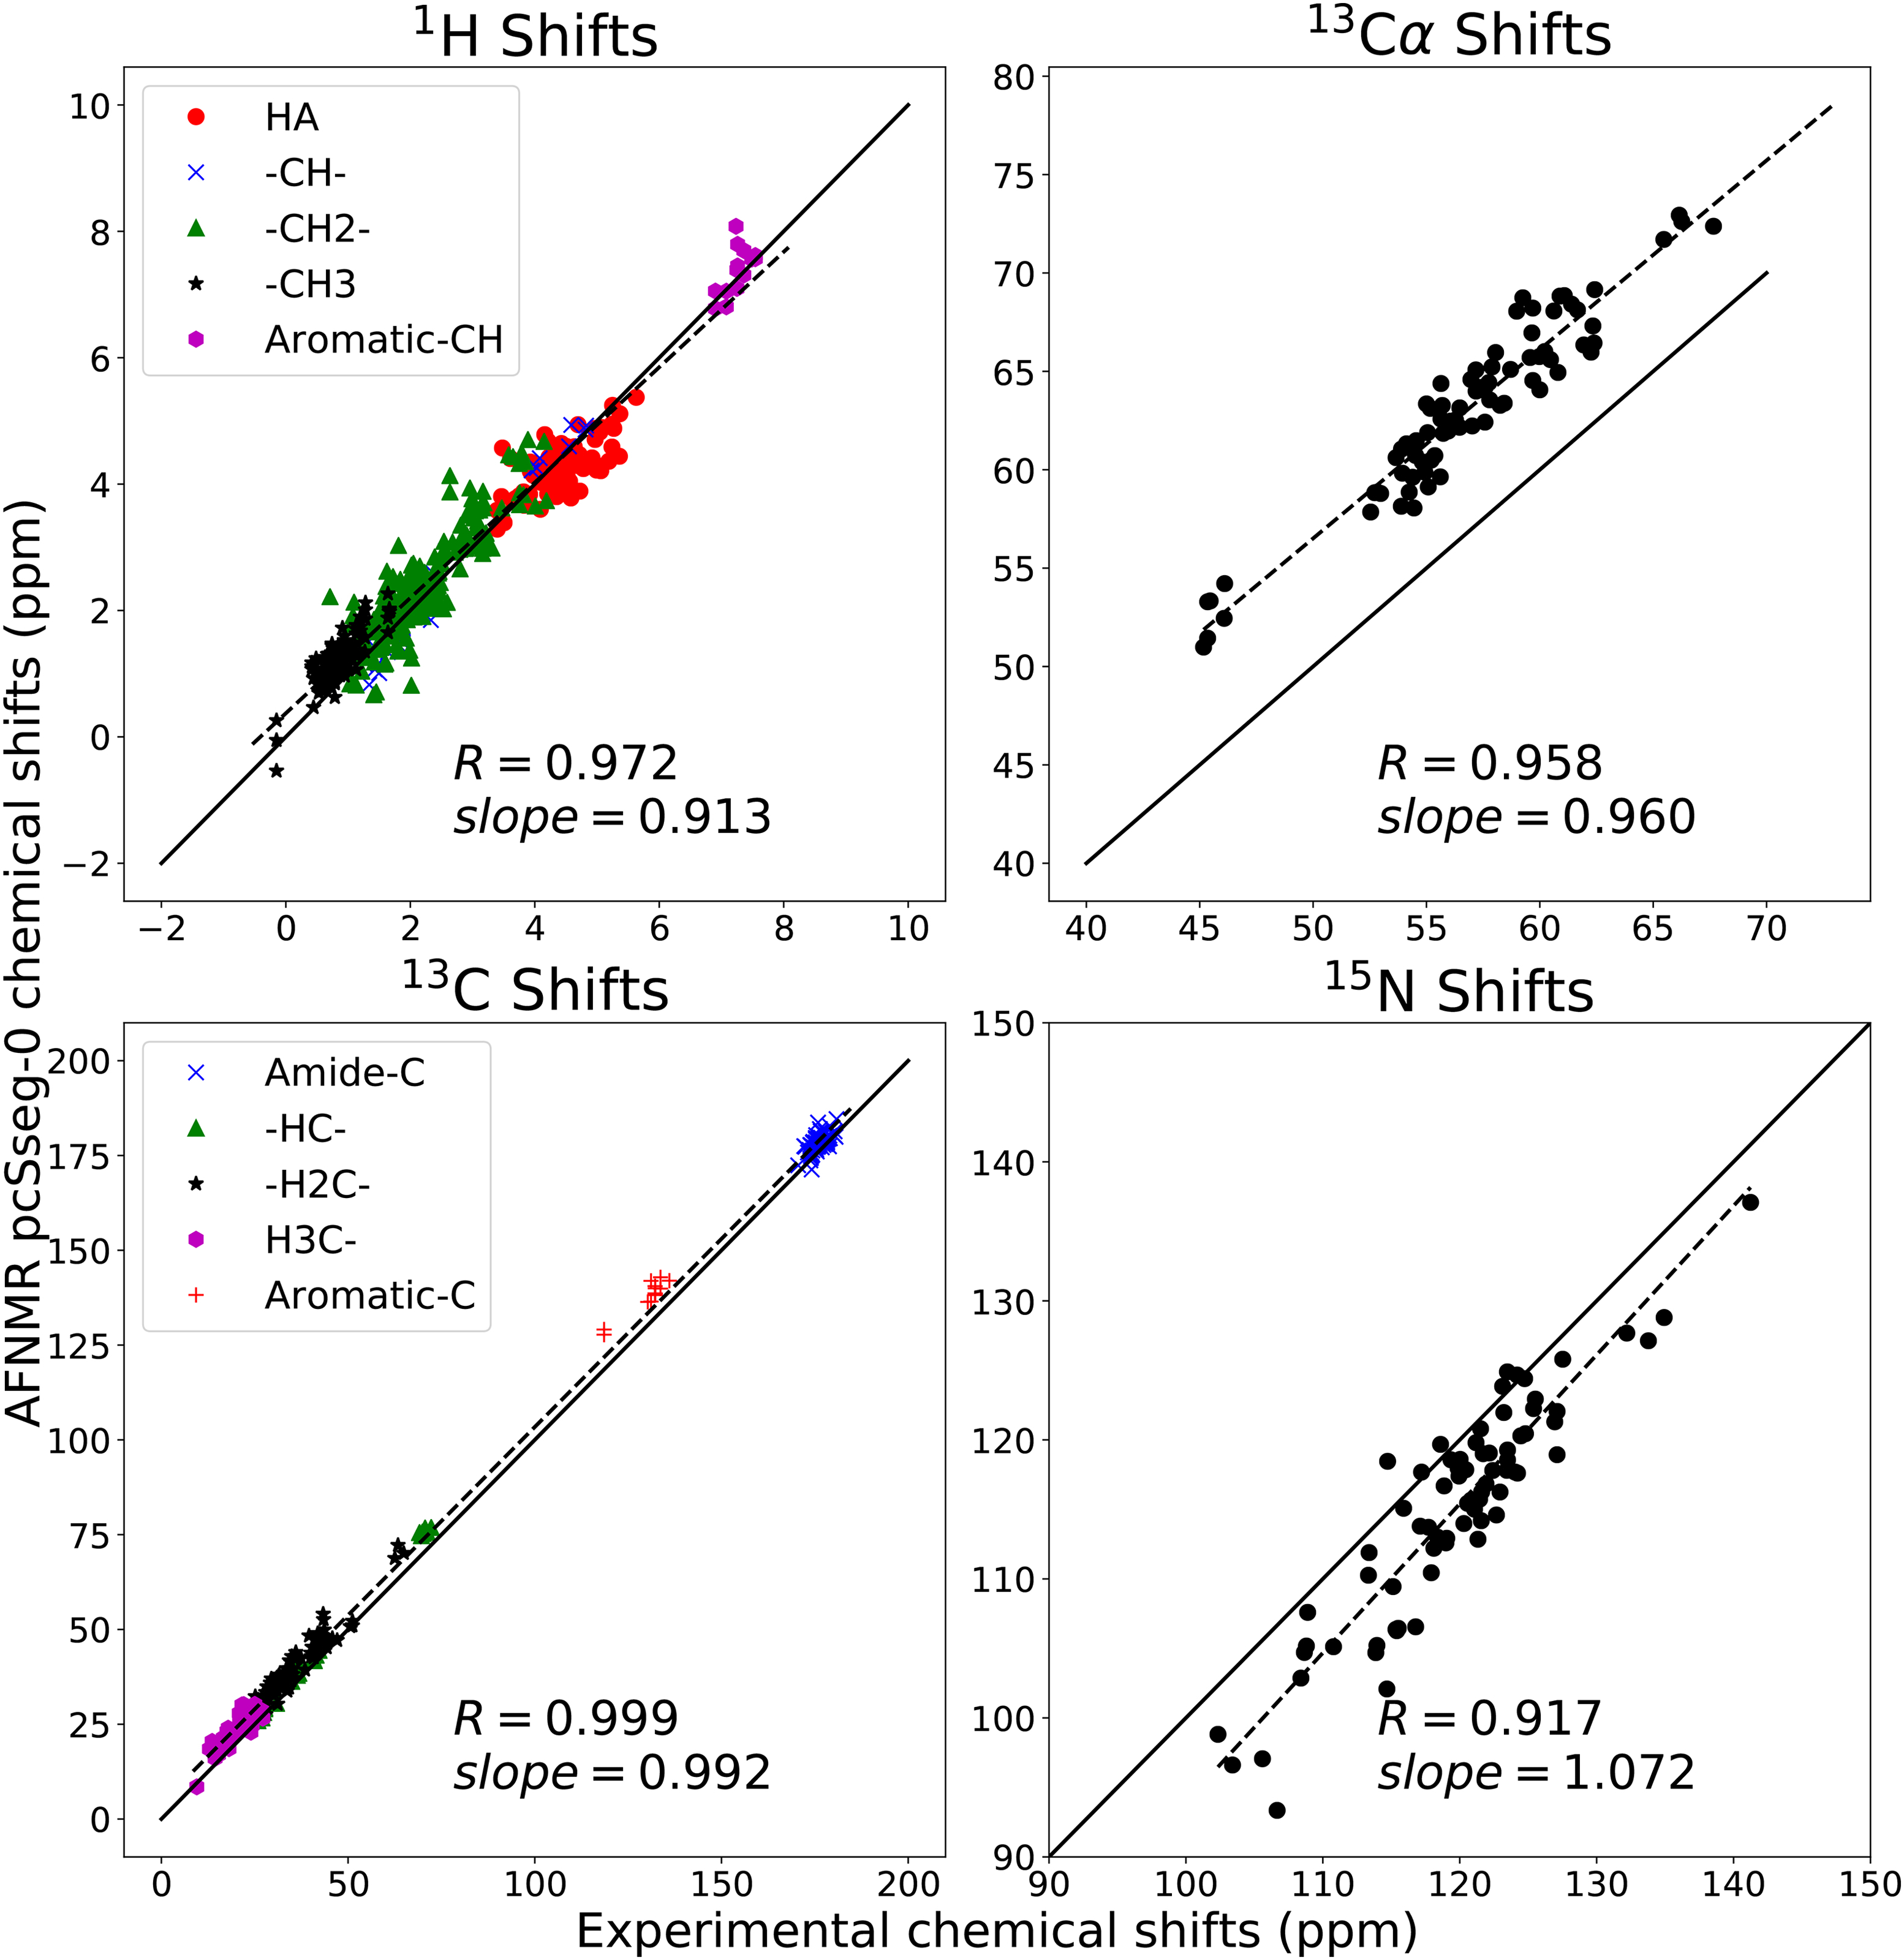
Figure 4:

Calculated vs. observed shifts for ubiquitin. Calculated values are the average shift for the ten models in PDB ID 1d3z, at the OLYP/pcSseg-0 level. Observed shifts are from BMRB entry bmr17769. Solid line is y = x ; dashed line is a least-squares best-fit line,whose slope is shown. R is the Pearson correlation coefficient.
