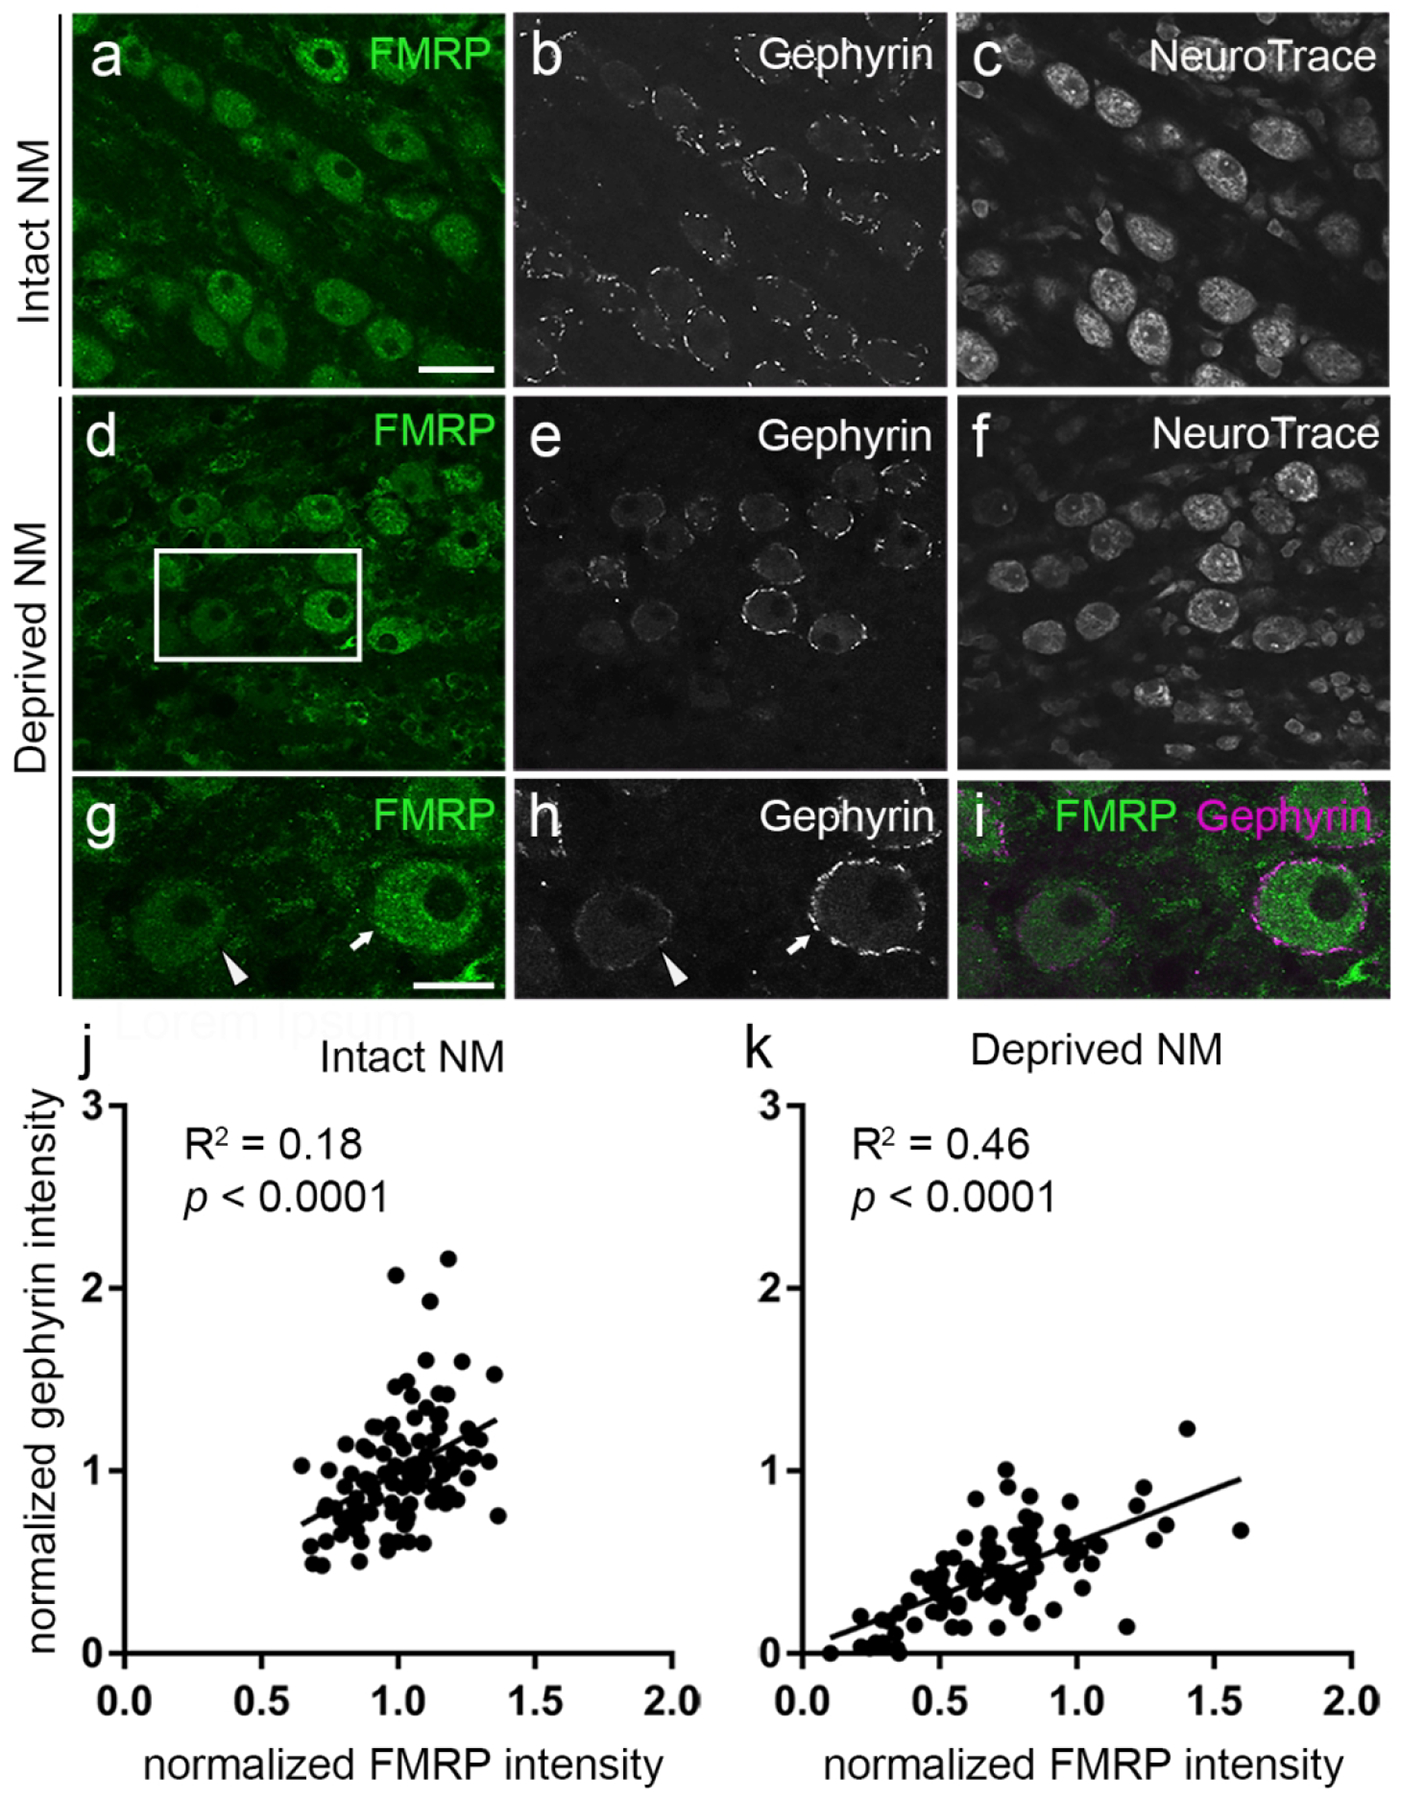
Figure 12. Correlation of FMRP intensity with gephyrin intensity at 1–2 weeks after unilateral cochlea removal.

a-f: Representative images of triple-labeling of FMRP, gephyrin, and NeuroTrace in the intact (a-c) and afferent-deprived (d-f) NMs, respectively. g-i: Higher-magnification views of the boxed region in d. Arrows indicate a neuron with relatively higher FMRP and gephyrin intensities. Arrowheads indicate a neuron with relatively lower FMRP and gephyrin intensities. j-k: Scatter plots showing correlations between normalized FMRP intensity and normalized gephyrin intensity in the intact (j) and afferent-deprived (k) NMs, respectively. Abbreviation: NM, nucleus magnocellularis. Scale bars = 30 μm in a (applies to a-f); 15 μm in g (applies to g-i).
