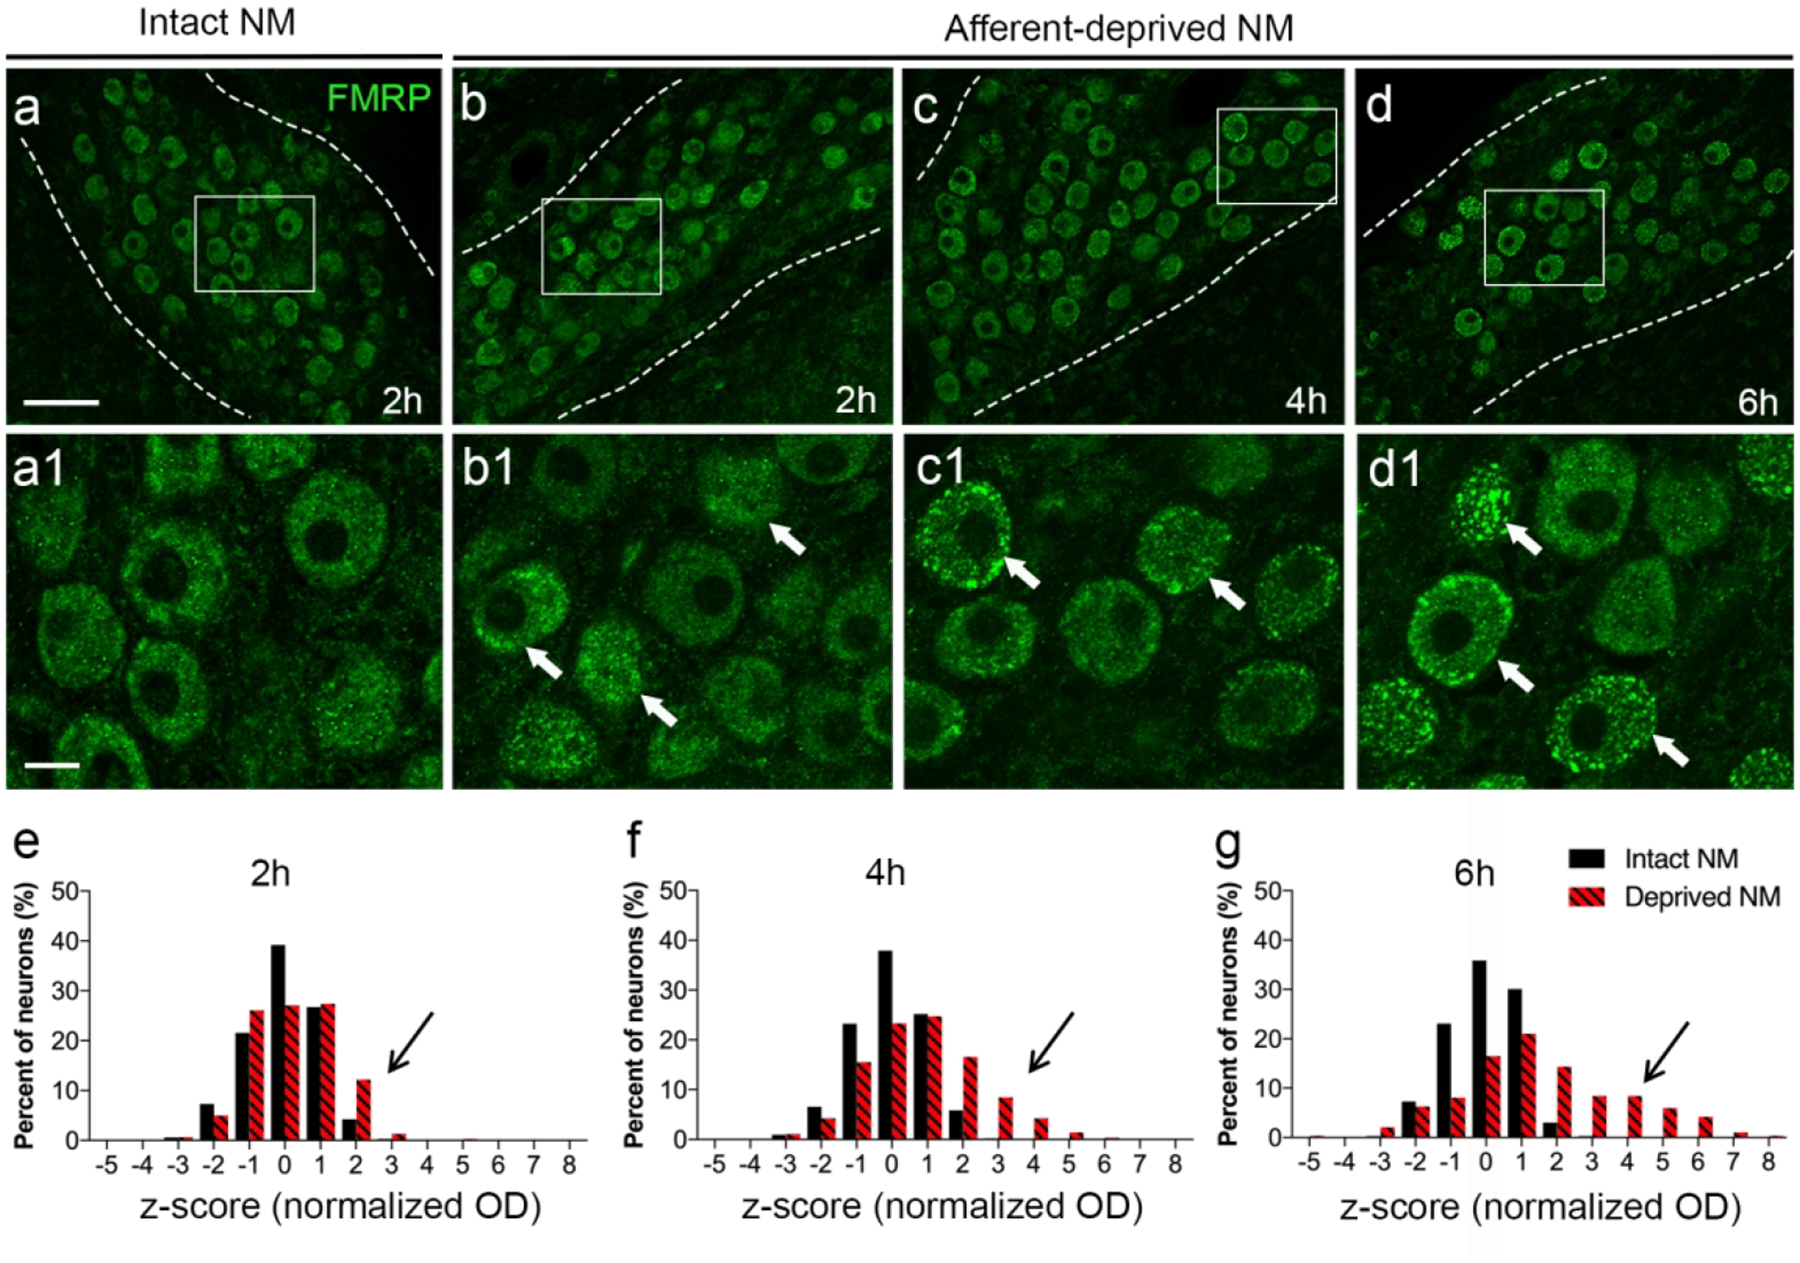
Figure 3. Time course of FMRP immunoreactivity changes in NM neurons at 2–6 hours following unilateral cochlea removal.

a-d: Representative images showing FMRP immunoreactivity in the intact (a) and afferent-deprived NMs at 2, 4, and 6 hours (b-d), respectively. Dashed lines outline the border of NM. a1-d1: High-magnification views of the boxes in a-d, respectively. Arrows point to neurons exhibiting distinct FMRP puncta in the afferent-deprived NM. e-g: Frequency histograms of z-scores of FMRP immunoreactivity in the intact and afferent-deprived NMs. Arrows in e-g point to a shift of z-scores toward the positive direction. Abbreviations: h, hour; NM, nucleus magnocellularis; OD, optical density. Scale bars = 50 μm in a (applies to a-d); 10 μm in A1 (applies to a1-d1).
