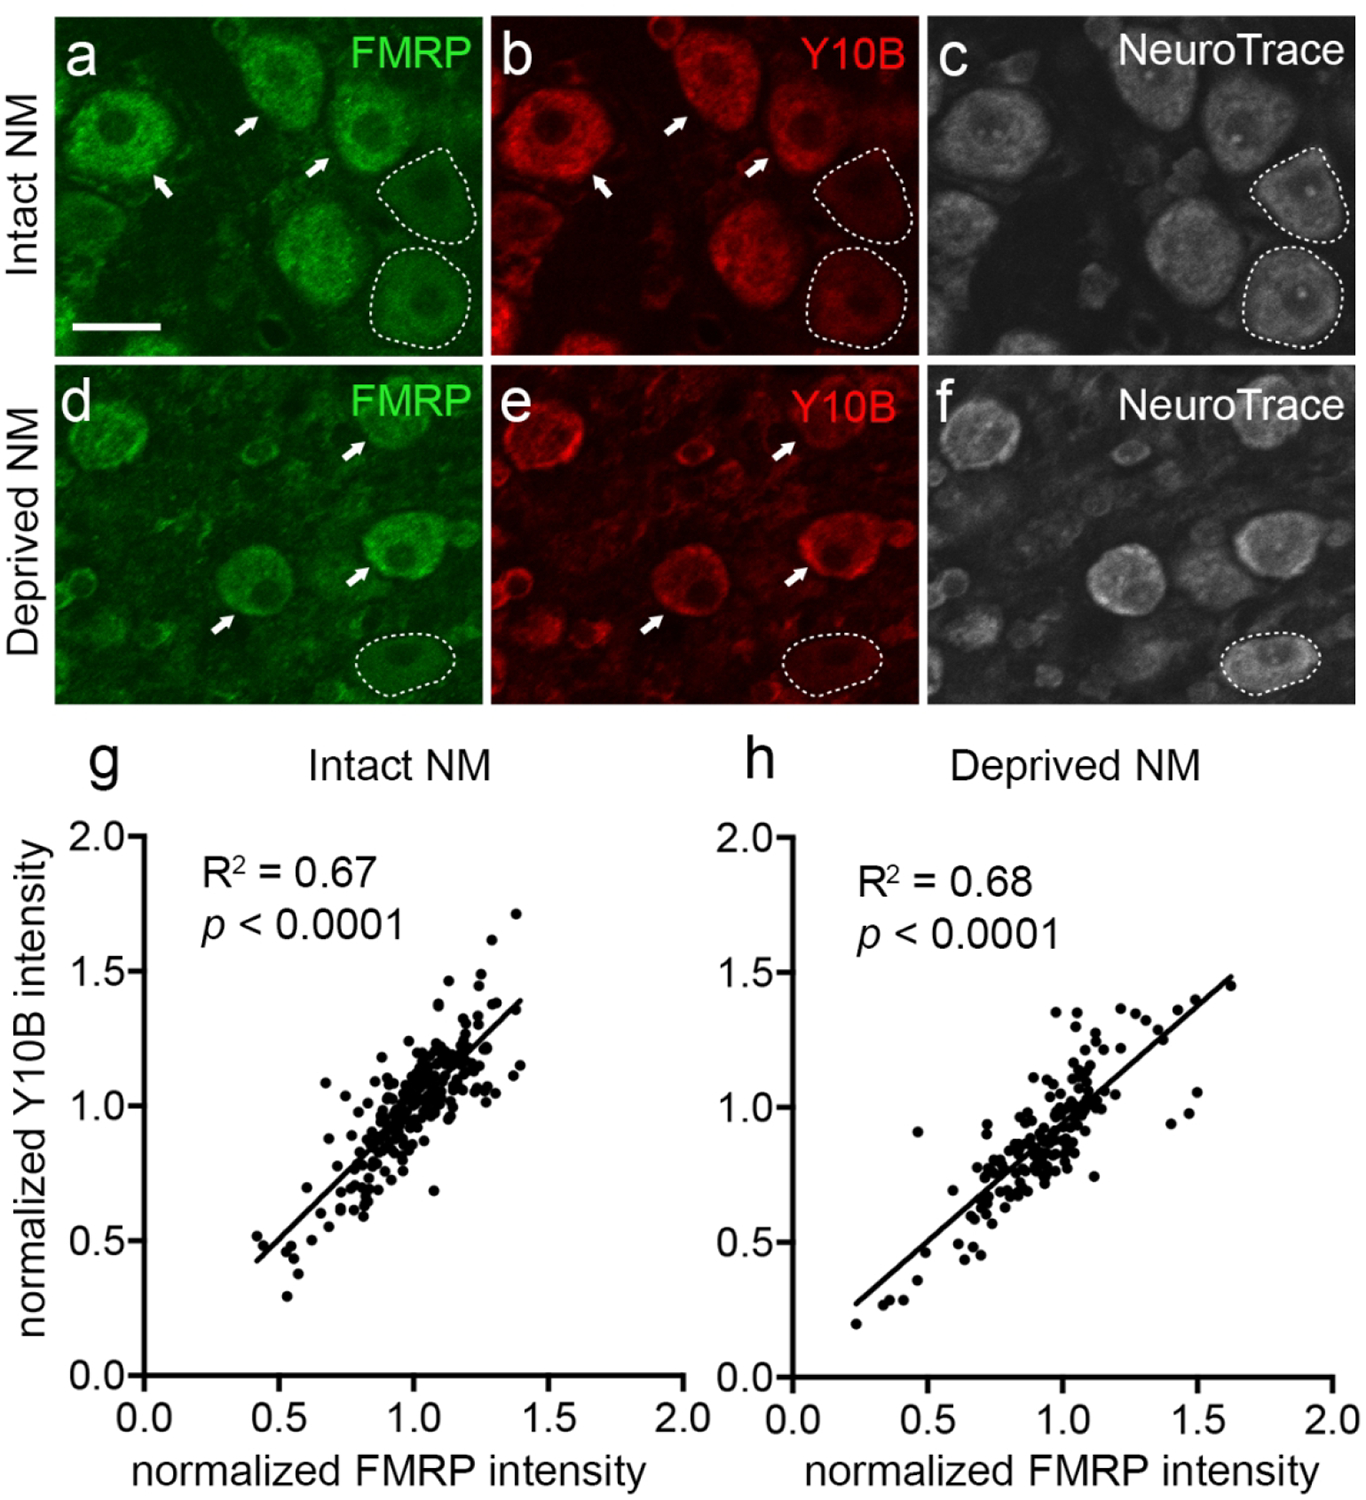
Figure 9. Correlation of FMRP intensity with Y10B intensity at 1–2 weeks after unilateral cochlea removal.

a-f: Representative images of triple-labeling of FMRP, Y10B, and NeuroTrace in the intact (a-c) and afferent-deprived (d-f) NMs, respectively. Arrows indicate neurons with relatively higher FMRP and Y10B intensities. Dashed lines outline neurons with lower FMRP and Y10B intensities. g-h: Scatter plots showing correlations between normalized FMRP intensity and normalized Y10B intensity in the intact (g) and afferent-deprived (h) NMs, respectively. Abbreviation: NM, nucleus magnocellularis. Scale bar = 15 μm in a (applies to a-f).
