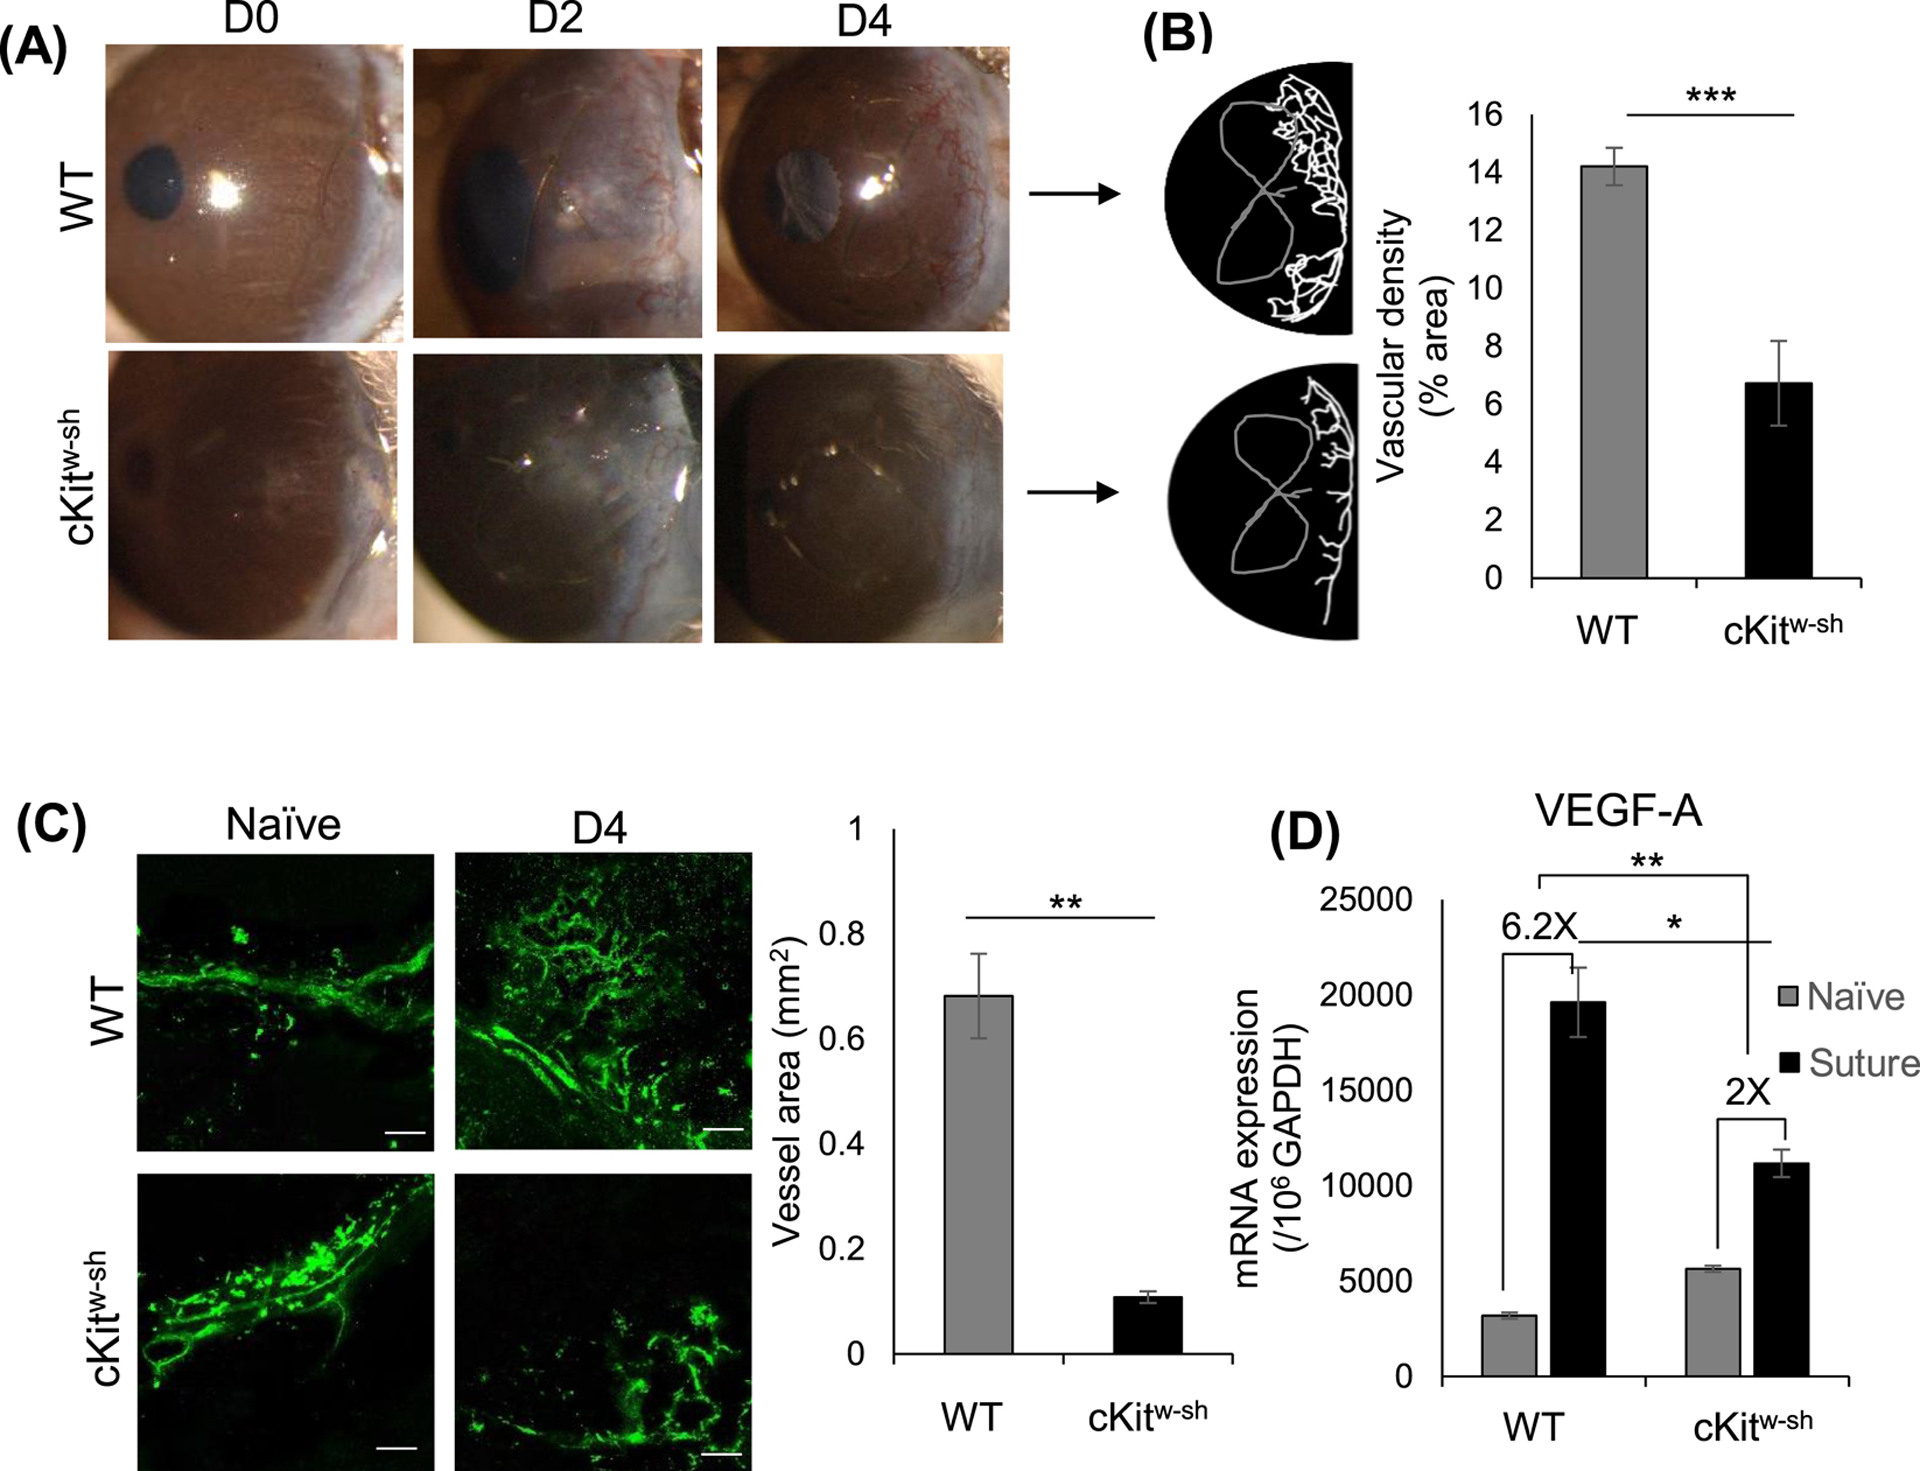
Figure 2. Mast cell-deficient mice develop reduced corneal neovascularization.

(A) Representative slit-lamp biomicroscope photographs of naïve and sutured corneas of wild type (C57BL/6) and cKitw-sh mice on days 0, 2, and 4 post-suture placement. (B) Binary image (left) and cumulative bar chart (right) depicting the vascular density of corneal neovascularization. Slit-lamp photographs were converted into binary images, and vascular density as percent area of the vessels in the total cornea was calculated using the ‘Vessel analysis’ plugin in ImageJ 1.52S software. (C) Corneas were harvested on day 4 post-suture placement and immunostained with CD31 (FITC). Representative immunohistochemistry micrographs (left) and cumulative bar chart (right) showing vessel area in corneas of WT and cKitw-sh mice. ImageJ 1.52S software was used to quantify the vessel area (Scale bar, 100 μm). (D) Bar chart depicting expression of VEGF-A in the cornea post-suture compared to naïve state, as quantified by real-time PCR. WT and cKitw-sh mice showed a 6.2-fold and 2-fold increase in VEGF-A expression post-suture placement, respectively. Representative data from three independent experiments are shown, and each experiment consisted of n = 3 animals/group. Data are represented as mean ± SD (error bar). T-test; *p < 0.05, **p < 0.01, ***p < 0.001.
